Immigrants from Oceania vs Assyrian/Chaldean/Syriac Male Poverty
COMPARE
Immigrants from Oceania
Assyrian/Chaldean/Syriac
Male Poverty
Male Poverty Comparison
Immigrants from Oceania
Assyrians/Chaldeans/Syriacs
11.2%
MALE POVERTY
50.0/ 100
METRIC RATING
174th/ 347
METRIC RANK
9.1%
MALE POVERTY
99.9/ 100
METRIC RATING
6th/ 347
METRIC RANK
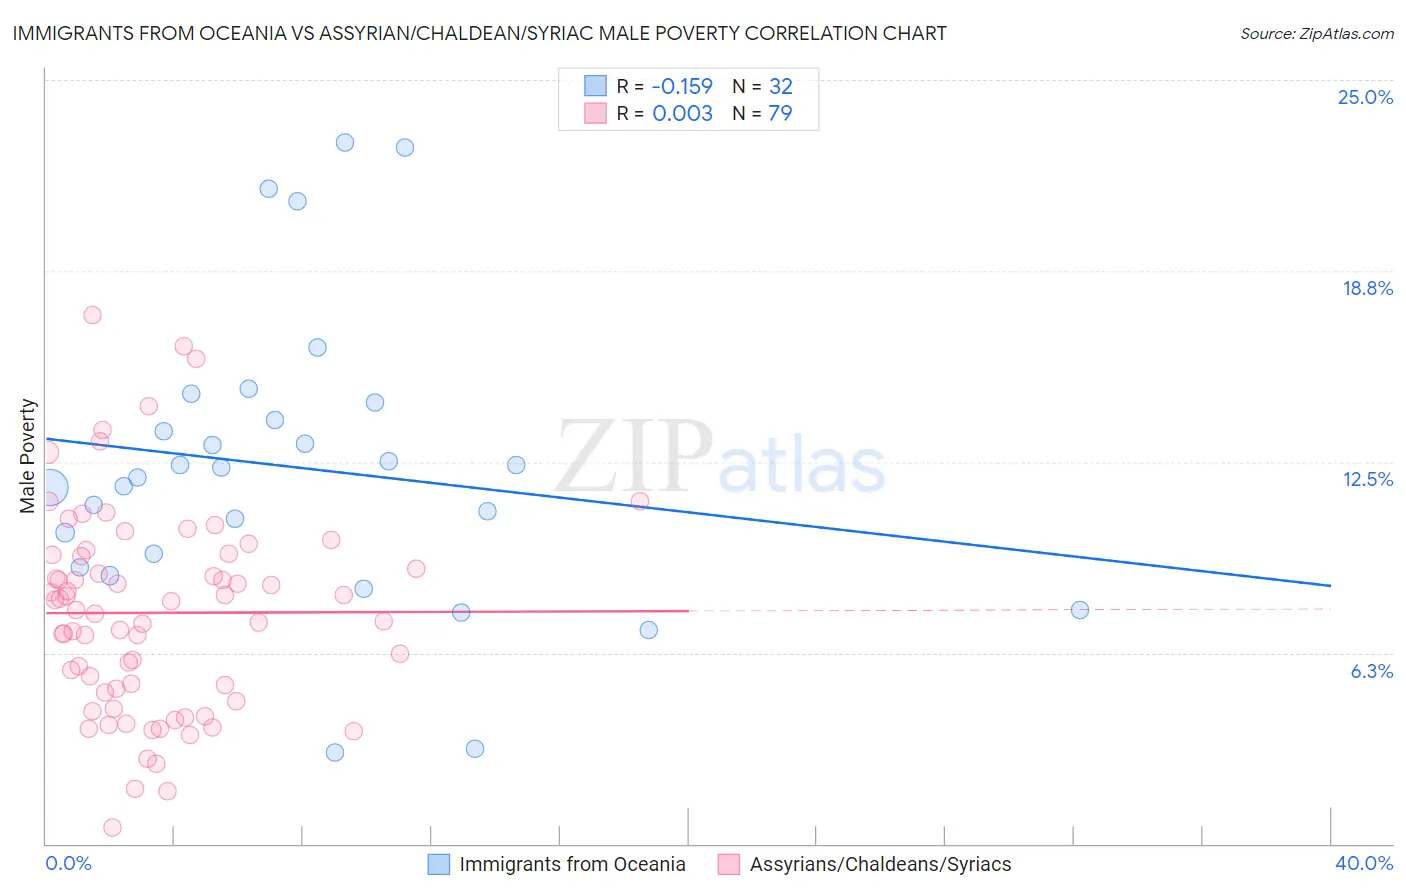
Immigrants from Oceania vs Assyrian/Chaldean/Syriac Male Poverty Correlation Chart
The statistical analysis conducted on geographies consisting of 305,340,172 people shows a poor negative correlation between the proportion of Immigrants from Oceania and poverty level among males in the United States with a correlation coefficient (R) of -0.159 and weighted average of 11.2%. Similarly, the statistical analysis conducted on geographies consisting of 110,288,408 people shows no correlation between the proportion of Assyrians/Chaldeans/Syriacs and poverty level among males in the United States with a correlation coefficient (R) of 0.003 and weighted average of 9.1%, a difference of 22.5%.
Male Poverty Correlation Summary
| Measurement | Immigrants from Oceania | Assyrian/Chaldean/Syriac |
| Minimum | 3.0% | 0.52% |
| Maximum | 23.0% | 17.3% |
| Range | 20.0% | 16.8% |
| Mean | 12.3% | 7.6% |
| Median | 12.1% | 7.6% |
| Interquartile 25% (IQ1) | 9.3% | 4.9% |
| Interquartile 75% (IQ3) | 14.2% | 9.4% |
| Interquartile Range (IQR) | 4.9% | 4.5% |
| Standard Deviation (Sample) | 4.8% | 3.4% |
| Standard Deviation (Population) | 4.8% | 3.4% |
Similar Demographics by Male Poverty
Demographics Similar to Immigrants from Oceania by Male Poverty
In terms of male poverty, the demographic groups most similar to Immigrants from Oceania are Pennsylvania German (11.2%, a difference of 0.040%), Immigrants from Ethiopia (11.2%, a difference of 0.070%), Uruguayan (11.2%, a difference of 0.10%), Celtic (11.2%, a difference of 0.25%), and South American (11.1%, a difference of 0.37%).
| Demographics | Rating | Rank | Male Poverty |
| Hungarians | 55.1 /100 | #167 | Average 11.1% |
| Immigrants | Portugal | 54.9 /100 | #168 | Average 11.1% |
| Immigrants | Colombia | 54.2 /100 | #169 | Average 11.1% |
| South Americans | 53.8 /100 | #170 | Average 11.1% |
| Uruguayans | 51.0 /100 | #171 | Average 11.2% |
| Immigrants | Ethiopia | 50.7 /100 | #172 | Average 11.2% |
| Pennsylvania Germans | 50.5 /100 | #173 | Average 11.2% |
| Immigrants | Oceania | 50.0 /100 | #174 | Average 11.2% |
| Celtics | 47.5 /100 | #175 | Average 11.2% |
| Immigrants | Fiji | 46.0 /100 | #176 | Average 11.2% |
| Lebanese | 45.6 /100 | #177 | Average 11.2% |
| Immigrants | Cameroon | 44.5 /100 | #178 | Average 11.2% |
| Immigrants | Syria | 40.3 /100 | #179 | Average 11.3% |
| Immigrants | Morocco | 40.1 /100 | #180 | Average 11.3% |
| Immigrants | Costa Rica | 39.5 /100 | #181 | Fair 11.3% |
Demographics Similar to Assyrians/Chaldeans/Syriacs by Male Poverty
In terms of male poverty, the demographic groups most similar to Assyrians/Chaldeans/Syriacs are Immigrants from Ireland (9.1%, a difference of 0.080%), Maltese (9.1%, a difference of 0.66%), Filipino (9.2%, a difference of 0.75%), Immigrants from South Central Asia (9.3%, a difference of 1.5%), and Bulgarian (9.3%, a difference of 2.1%).
| Demographics | Rating | Rank | Male Poverty |
| Immigrants | India | 100.0 /100 | #1 | Exceptional 8.2% |
| Chinese | 100.0 /100 | #2 | Exceptional 8.7% |
| Thais | 100.0 /100 | #3 | Exceptional 8.7% |
| Immigrants | Taiwan | 100.0 /100 | #4 | Exceptional 8.9% |
| Maltese | 100.0 /100 | #5 | Exceptional 9.1% |
| Assyrians/Chaldeans/Syriacs | 99.9 /100 | #6 | Exceptional 9.1% |
| Immigrants | Ireland | 99.9 /100 | #7 | Exceptional 9.1% |
| Filipinos | 99.9 /100 | #8 | Exceptional 9.2% |
| Immigrants | South Central Asia | 99.9 /100 | #9 | Exceptional 9.3% |
| Bulgarians | 99.9 /100 | #10 | Exceptional 9.3% |
| Bolivians | 99.9 /100 | #11 | Exceptional 9.4% |
| Immigrants | Bolivia | 99.9 /100 | #12 | Exceptional 9.4% |
| Immigrants | Lithuania | 99.9 /100 | #13 | Exceptional 9.4% |
| Immigrants | North Macedonia | 99.8 /100 | #14 | Exceptional 9.4% |
| Bhutanese | 99.8 /100 | #15 | Exceptional 9.5% |