Immigrants from Oceania vs Dominican Single Father Poverty
COMPARE
Immigrants from Oceania
Dominican
Single Father Poverty
Single Father Poverty Comparison
Immigrants from Oceania
Dominicans
15.4%
SINGLE FATHER POVERTY
99.1/ 100
METRIC RATING
85th/ 347
METRIC RANK
19.1%
SINGLE FATHER POVERTY
0.0/ 100
METRIC RATING
317th/ 347
METRIC RANK
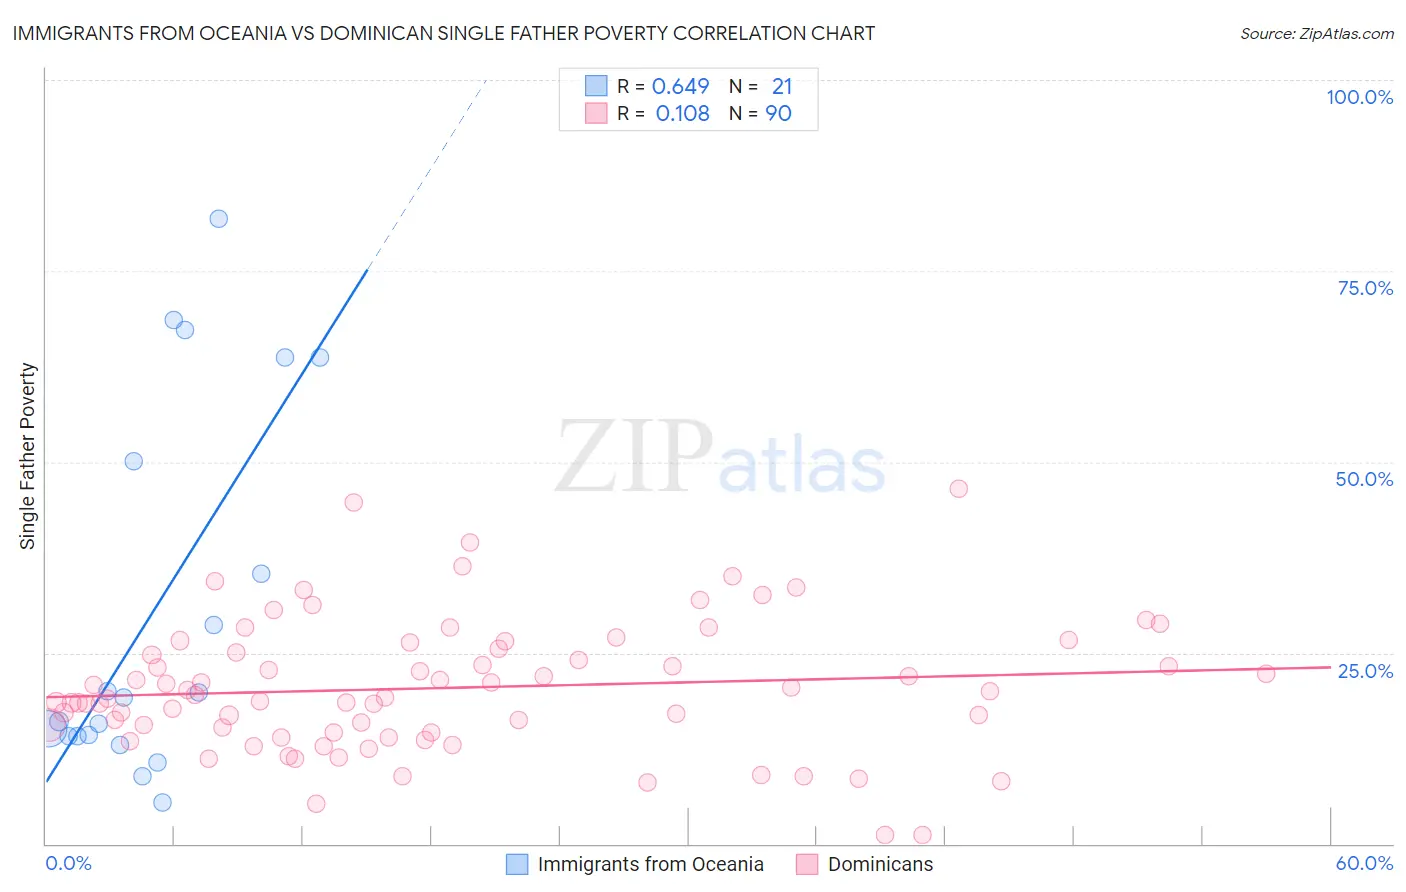
Immigrants from Oceania vs Dominican Single Father Poverty Correlation Chart
The statistical analysis conducted on geographies consisting of 248,038,914 people shows a significant positive correlation between the proportion of Immigrants from Oceania and poverty level among single fathers in the United States with a correlation coefficient (R) of 0.649 and weighted average of 15.4%. Similarly, the statistical analysis conducted on geographies consisting of 286,118,760 people shows a poor positive correlation between the proportion of Dominicans and poverty level among single fathers in the United States with a correlation coefficient (R) of 0.108 and weighted average of 19.1%, a difference of 23.6%.
Single Father Poverty Correlation Summary
| Measurement | Immigrants from Oceania | Dominican |
| Minimum | 5.4% | 1.2% |
| Maximum | 81.8% | 46.5% |
| Range | 76.5% | 45.2% |
| Mean | 30.7% | 20.4% |
| Median | 19.1% | 19.4% |
| Interquartile 25% (IQ1) | 14.1% | 14.6% |
| Interquartile 75% (IQ3) | 56.9% | 25.5% |
| Interquartile Range (IQR) | 42.8% | 10.9% |
| Standard Deviation (Sample) | 24.2% | 8.6% |
| Standard Deviation (Population) | 23.6% | 8.6% |
Similar Demographics by Single Father Poverty
Demographics Similar to Immigrants from Oceania by Single Father Poverty
In terms of single father poverty, the demographic groups most similar to Immigrants from Oceania are Peruvian (15.4%, a difference of 0.12%), Immigrants from Russia (15.5%, a difference of 0.12%), Brazilian (15.5%, a difference of 0.13%), Burmese (15.5%, a difference of 0.16%), and Immigrants from Korea (15.5%, a difference of 0.22%).
| Demographics | Rating | Rank | Single Father Poverty |
| Tlingit-Haida | 99.5 /100 | #78 | Exceptional 15.3% |
| Immigrants | Northern Africa | 99.5 /100 | #79 | Exceptional 15.3% |
| Armenians | 99.4 /100 | #80 | Exceptional 15.4% |
| Immigrants | Congo | 99.4 /100 | #81 | Exceptional 15.4% |
| Immigrants | Ukraine | 99.4 /100 | #82 | Exceptional 15.4% |
| Chinese | 99.3 /100 | #83 | Exceptional 15.4% |
| Peruvians | 99.2 /100 | #84 | Exceptional 15.4% |
| Immigrants | Oceania | 99.1 /100 | #85 | Exceptional 15.4% |
| Immigrants | Russia | 99.0 /100 | #86 | Exceptional 15.5% |
| Brazilians | 99.0 /100 | #87 | Exceptional 15.5% |
| Burmese | 99.0 /100 | #88 | Exceptional 15.5% |
| Immigrants | Korea | 99.0 /100 | #89 | Exceptional 15.5% |
| Mexican American Indians | 98.7 /100 | #90 | Exceptional 15.5% |
| Immigrants | Romania | 98.6 /100 | #91 | Exceptional 15.5% |
| Immigrants | Serbia | 98.5 /100 | #92 | Exceptional 15.5% |
Demographics Similar to Dominicans by Single Father Poverty
In terms of single father poverty, the demographic groups most similar to Dominicans are Osage (19.0%, a difference of 0.31%), Dutch West Indian (19.2%, a difference of 0.58%), Chickasaw (19.0%, a difference of 0.71%), Delaware (18.9%, a difference of 0.87%), and Potawatomi (18.9%, a difference of 1.0%).
| Demographics | Rating | Rank | Single Father Poverty |
| Chippewa | 0.0 /100 | #310 | Tragic 18.8% |
| Immigrants | Nonimmigrants | 0.0 /100 | #311 | Tragic 18.8% |
| Immigrants | Dominica | 0.0 /100 | #312 | Tragic 18.9% |
| Potawatomi | 0.0 /100 | #313 | Tragic 18.9% |
| Delaware | 0.0 /100 | #314 | Tragic 18.9% |
| Chickasaw | 0.0 /100 | #315 | Tragic 19.0% |
| Osage | 0.0 /100 | #316 | Tragic 19.0% |
| Dominicans | 0.0 /100 | #317 | Tragic 19.1% |
| Dutch West Indians | 0.0 /100 | #318 | Tragic 19.2% |
| Slovaks | 0.0 /100 | #319 | Tragic 19.3% |
| Inupiat | 0.0 /100 | #320 | Tragic 19.5% |
| Cherokee | 0.0 /100 | #321 | Tragic 19.6% |
| Creek | 0.0 /100 | #322 | Tragic 19.8% |
| Pennsylvania Germans | 0.0 /100 | #323 | Tragic 20.0% |
| Americans | 0.0 /100 | #324 | Tragic 20.1% |