Immigrants from Oceania vs Dominican Family Households with Children
COMPARE
Immigrants from Oceania
Dominican
Family Households with Children
Family Households with Children Comparison
Immigrants from Oceania
Dominicans
28.1%
FAMILY HOUSEHOLDS WITH CHILDREN
98.8/ 100
METRIC RATING
101st/ 347
METRIC RANK
27.5%
FAMILY HOUSEHOLDS WITH CHILDREN
61.1/ 100
METRIC RATING
167th/ 347
METRIC RANK
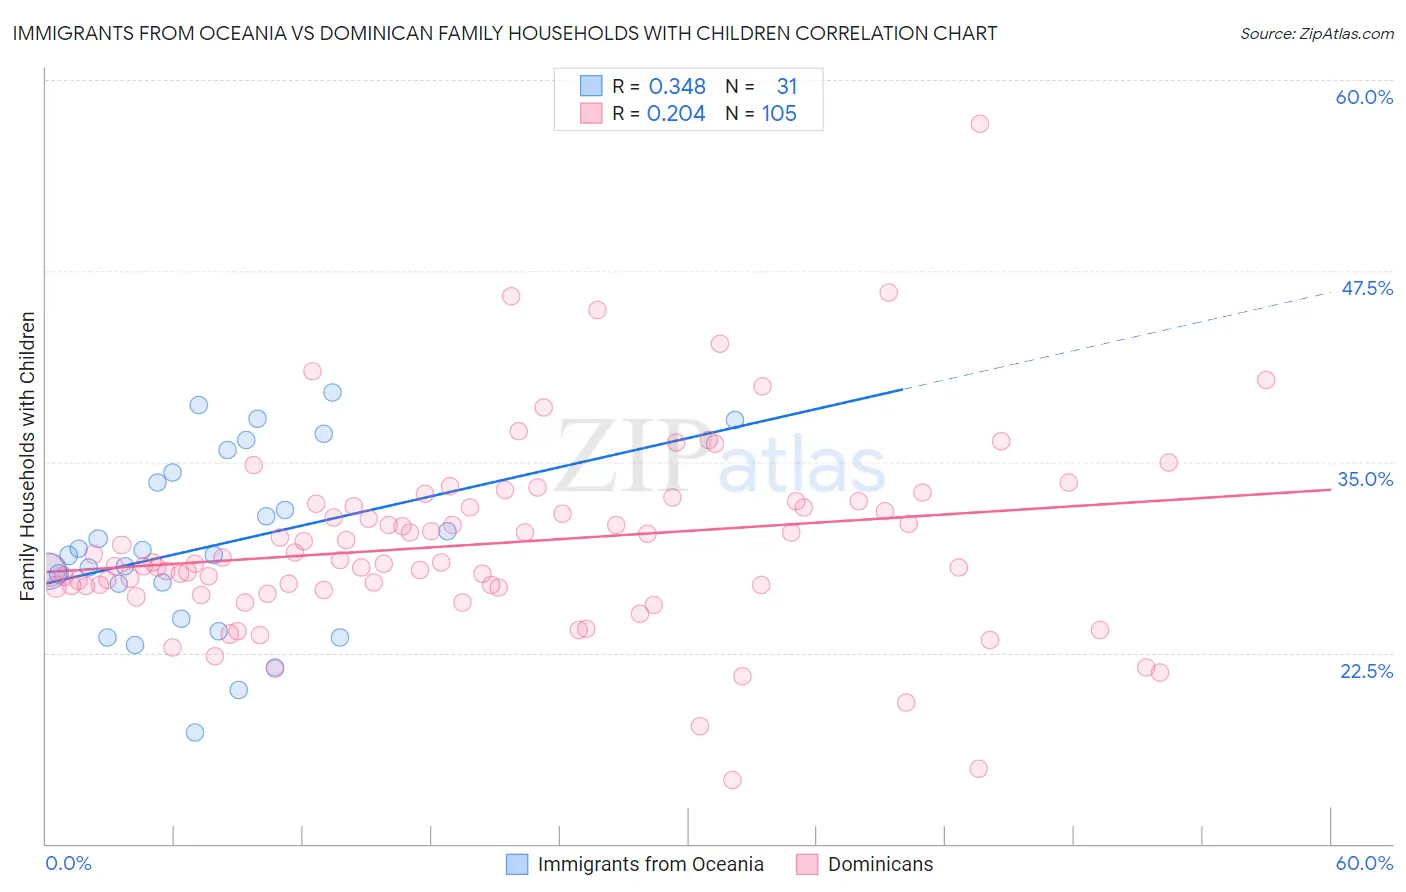
Immigrants from Oceania vs Dominican Family Households with Children Correlation Chart
The statistical analysis conducted on geographies consisting of 305,304,848 people shows a mild positive correlation between the proportion of Immigrants from Oceania and percentage of family households with children in the United States with a correlation coefficient (R) of 0.348 and weighted average of 28.1%. Similarly, the statistical analysis conducted on geographies consisting of 354,685,536 people shows a weak positive correlation between the proportion of Dominicans and percentage of family households with children in the United States with a correlation coefficient (R) of 0.204 and weighted average of 27.5%, a difference of 2.2%.
Family Households with Children Correlation Summary
| Measurement | Immigrants from Oceania | Dominican |
| Minimum | 17.3% | 14.2% |
| Maximum | 39.5% | 57.1% |
| Range | 22.2% | 43.0% |
| Mean | 29.5% | 29.6% |
| Median | 28.9% | 28.4% |
| Interquartile 25% (IQ1) | 24.7% | 26.8% |
| Interquartile 75% (IQ3) | 34.3% | 32.2% |
| Interquartile Range (IQR) | 9.6% | 5.3% |
| Standard Deviation (Sample) | 5.8% | 6.3% |
| Standard Deviation (Population) | 5.7% | 6.3% |
Similar Demographics by Family Households with Children
Demographics Similar to Immigrants from Oceania by Family Households with Children
In terms of family households with children, the demographic groups most similar to Immigrants from Oceania are Immigrants from the Azores (28.1%, a difference of 0.020%), Indonesian (28.1%, a difference of 0.020%), Immigrants from Kenya (28.1%, a difference of 0.030%), Assyrian/Chaldean/Syriac (28.1%, a difference of 0.030%), and Chilean (28.1%, a difference of 0.080%).
| Demographics | Rating | Rank | Family Households with Children |
| Immigrants | Colombia | 99.2 /100 | #94 | Exceptional 28.2% |
| Immigrants | Nicaragua | 99.1 /100 | #95 | Exceptional 28.2% |
| Ute | 99.1 /100 | #96 | Exceptional 28.2% |
| Chileans | 98.9 /100 | #97 | Exceptional 28.1% |
| Immigrants | Kenya | 98.9 /100 | #98 | Exceptional 28.1% |
| Immigrants | Azores | 98.8 /100 | #99 | Exceptional 28.1% |
| Indonesians | 98.8 /100 | #100 | Exceptional 28.1% |
| Immigrants | Oceania | 98.8 /100 | #101 | Exceptional 28.1% |
| Assyrians/Chaldeans/Syriacs | 98.7 /100 | #102 | Exceptional 28.1% |
| Palestinians | 98.5 /100 | #103 | Exceptional 28.1% |
| Sioux | 98.3 /100 | #104 | Exceptional 28.1% |
| Choctaw | 98.3 /100 | #105 | Exceptional 28.1% |
| Immigrants | South America | 98.0 /100 | #106 | Exceptional 28.0% |
| Immigrants | Uganda | 97.7 /100 | #107 | Exceptional 28.0% |
| Immigrants | Burma/Myanmar | 97.7 /100 | #108 | Exceptional 28.0% |
Demographics Similar to Dominicans by Family Households with Children
In terms of family households with children, the demographic groups most similar to Dominicans are Immigrants from South Africa (27.5%, a difference of 0.0%), Nonimmigrants (27.5%, a difference of 0.0%), Immigrants from Kuwait (27.5%, a difference of 0.010%), Immigrants from Hong Kong (27.5%, a difference of 0.090%), and Czech (27.5%, a difference of 0.10%).
| Demographics | Rating | Rank | Family Households with Children |
| Sub-Saharan Africans | 67.5 /100 | #160 | Good 27.6% |
| Alaskan Athabascans | 67.1 /100 | #161 | Good 27.6% |
| Immigrants | Bangladesh | 67.0 /100 | #162 | Good 27.6% |
| Czechs | 65.3 /100 | #163 | Good 27.5% |
| Immigrants | Hong Kong | 64.9 /100 | #164 | Good 27.5% |
| Immigrants | South Africa | 61.3 /100 | #165 | Good 27.5% |
| Immigrants | Nonimmigrants | 61.2 /100 | #166 | Good 27.5% |
| Dominicans | 61.1 /100 | #167 | Good 27.5% |
| Immigrants | Kuwait | 60.9 /100 | #168 | Good 27.5% |
| Seminole | 56.9 /100 | #169 | Average 27.5% |
| Cherokee | 56.7 /100 | #170 | Average 27.5% |
| Blackfeet | 54.3 /100 | #171 | Average 27.5% |
| Israelis | 53.9 /100 | #172 | Average 27.5% |
| Immigrants | Argentina | 52.2 /100 | #173 | Average 27.5% |
| Whites/Caucasians | 50.0 /100 | #174 | Average 27.4% |