Immigrants from Oceania vs Dominican 9th Grade
COMPARE
Immigrants from Oceania
Dominican
9th Grade
9th Grade Comparison
Immigrants from Oceania
Dominicans
94.5%
9TH GRADE
12.1/ 100
METRIC RATING
213th/ 347
METRIC RANK
91.1%
9TH GRADE
0.0/ 100
METRIC RATING
328th/ 347
METRIC RANK
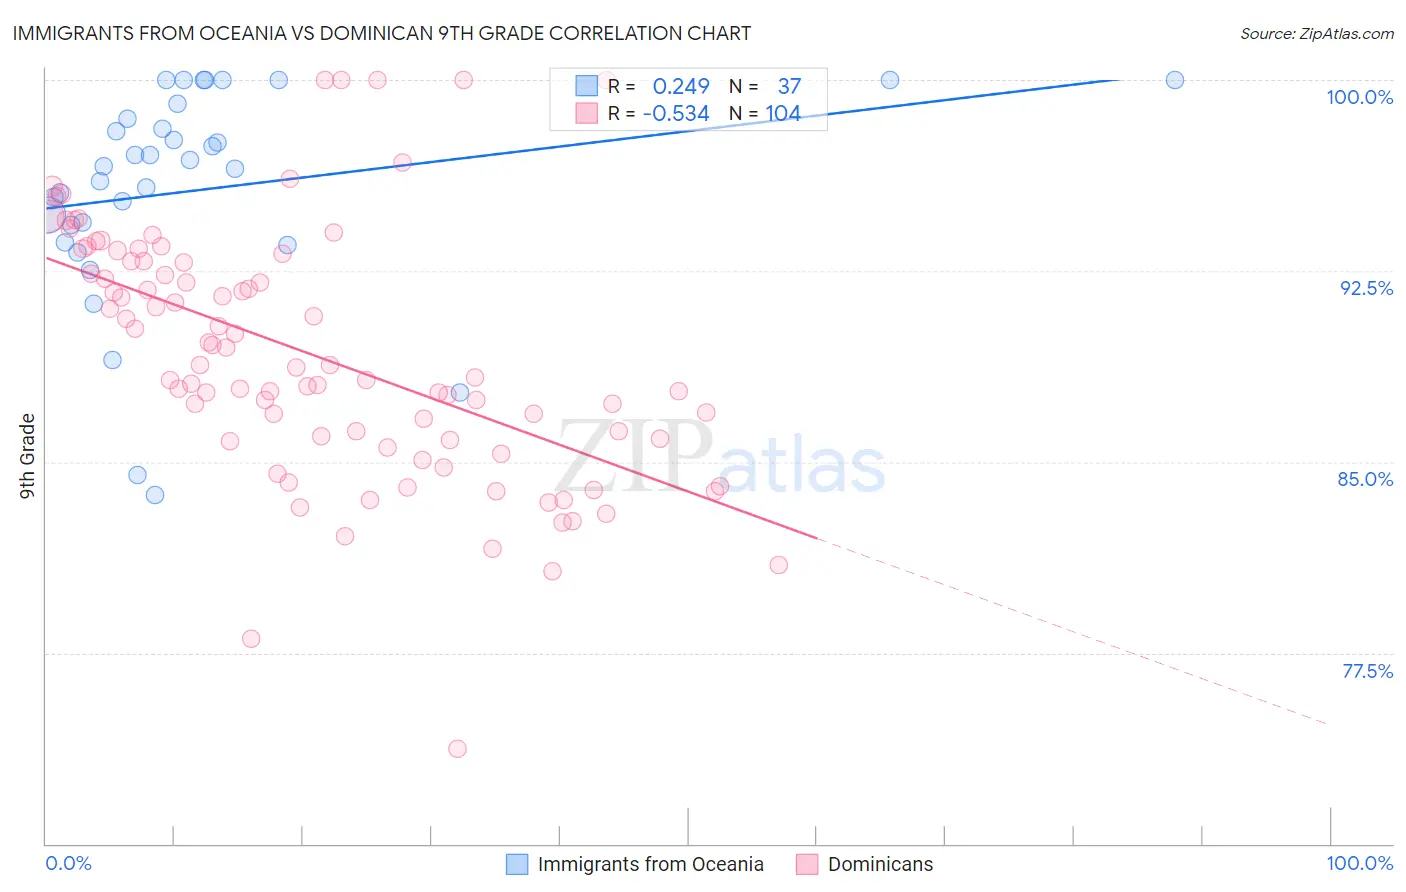
Immigrants from Oceania vs Dominican 9th Grade Correlation Chart
The statistical analysis conducted on geographies consisting of 305,521,521 people shows a weak positive correlation between the proportion of Immigrants from Oceania and percentage of population with at least 9th grade education in the United States with a correlation coefficient (R) of 0.249 and weighted average of 94.5%. Similarly, the statistical analysis conducted on geographies consisting of 355,142,452 people shows a substantial negative correlation between the proportion of Dominicans and percentage of population with at least 9th grade education in the United States with a correlation coefficient (R) of -0.534 and weighted average of 91.1%, a difference of 3.8%.
9th Grade Correlation Summary
| Measurement | Immigrants from Oceania | Dominican |
| Minimum | 83.7% | 73.7% |
| Maximum | 100.0% | 100.0% |
| Range | 16.3% | 26.3% |
| Mean | 95.7% | 89.2% |
| Median | 96.6% | 88.7% |
| Interquartile 25% (IQ1) | 94.0% | 85.9% |
| Interquartile 75% (IQ3) | 98.8% | 92.9% |
| Interquartile Range (IQR) | 4.8% | 7.0% |
| Standard Deviation (Sample) | 4.2% | 4.9% |
| Standard Deviation (Population) | 4.1% | 4.9% |
Similar Demographics by 9th Grade
Demographics Similar to Immigrants from Oceania by 9th Grade
In terms of 9th grade, the demographic groups most similar to Immigrants from Oceania are Immigrants from Indonesia (94.5%, a difference of 0.0%), Immigrants from Malaysia (94.5%, a difference of 0.0%), Immigrants from Liberia (94.5%, a difference of 0.0%), Immigrants from Chile (94.5%, a difference of 0.020%), and Immigrants from Syria (94.5%, a difference of 0.020%).
| Demographics | Rating | Rank | 9th Grade |
| Samoans | 17.3 /100 | #206 | Poor 94.6% |
| Immigrants | Morocco | 16.3 /100 | #207 | Poor 94.6% |
| Immigrants | Pakistan | 15.5 /100 | #208 | Poor 94.6% |
| Comanche | 14.9 /100 | #209 | Poor 94.6% |
| Immigrants | Chile | 13.4 /100 | #210 | Poor 94.5% |
| Immigrants | Indonesia | 12.3 /100 | #211 | Poor 94.5% |
| Immigrants | Malaysia | 12.2 /100 | #212 | Poor 94.5% |
| Immigrants | Oceania | 12.1 /100 | #213 | Poor 94.5% |
| Immigrants | Liberia | 11.8 /100 | #214 | Poor 94.5% |
| Immigrants | Syria | 11.0 /100 | #215 | Poor 94.5% |
| Immigrants | Western Asia | 10.7 /100 | #216 | Poor 94.5% |
| Asians | 9.9 /100 | #217 | Tragic 94.5% |
| Portuguese | 9.2 /100 | #218 | Tragic 94.5% |
| Africans | 9.0 /100 | #219 | Tragic 94.5% |
| Indians (Asian) | 8.6 /100 | #220 | Tragic 94.5% |
Demographics Similar to Dominicans by 9th Grade
In terms of 9th grade, the demographic groups most similar to Dominicans are Honduran (91.0%, a difference of 0.030%), Immigrants from Cabo Verde (90.9%, a difference of 0.15%), Mexican American Indian (90.9%, a difference of 0.18%), Hispanic or Latino (90.9%, a difference of 0.20%), and Immigrants from Yemen (90.8%, a difference of 0.29%).
| Demographics | Rating | Rank | 9th Grade |
| Immigrants | Ecuador | 0.0 /100 | #321 | Tragic 91.8% |
| Belizeans | 0.0 /100 | #322 | Tragic 91.8% |
| Puerto Ricans | 0.0 /100 | #323 | Tragic 91.8% |
| Immigrants | Belize | 0.0 /100 | #324 | Tragic 91.8% |
| Central American Indians | 0.0 /100 | #325 | Tragic 91.5% |
| Immigrants | Armenia | 0.0 /100 | #326 | Tragic 91.4% |
| Immigrants | Nicaragua | 0.0 /100 | #327 | Tragic 91.3% |
| Dominicans | 0.0 /100 | #328 | Tragic 91.1% |
| Hondurans | 0.0 /100 | #329 | Tragic 91.0% |
| Immigrants | Cabo Verde | 0.0 /100 | #330 | Tragic 90.9% |
| Mexican American Indians | 0.0 /100 | #331 | Tragic 90.9% |
| Hispanics or Latinos | 0.0 /100 | #332 | Tragic 90.9% |
| Immigrants | Yemen | 0.0 /100 | #333 | Tragic 90.8% |
| Immigrants | Azores | 0.0 /100 | #334 | Tragic 90.8% |
| Immigrants | Honduras | 0.0 /100 | #335 | Tragic 90.6% |