Creek vs Dominican Single Father Poverty
COMPARE
Creek
Dominican
Single Father Poverty
Single Father Poverty Comparison
Creek
Dominicans
19.8%
SINGLE FATHER POVERTY
0.0/ 100
METRIC RATING
322nd/ 347
METRIC RANK
19.1%
SINGLE FATHER POVERTY
0.0/ 100
METRIC RATING
317th/ 347
METRIC RANK
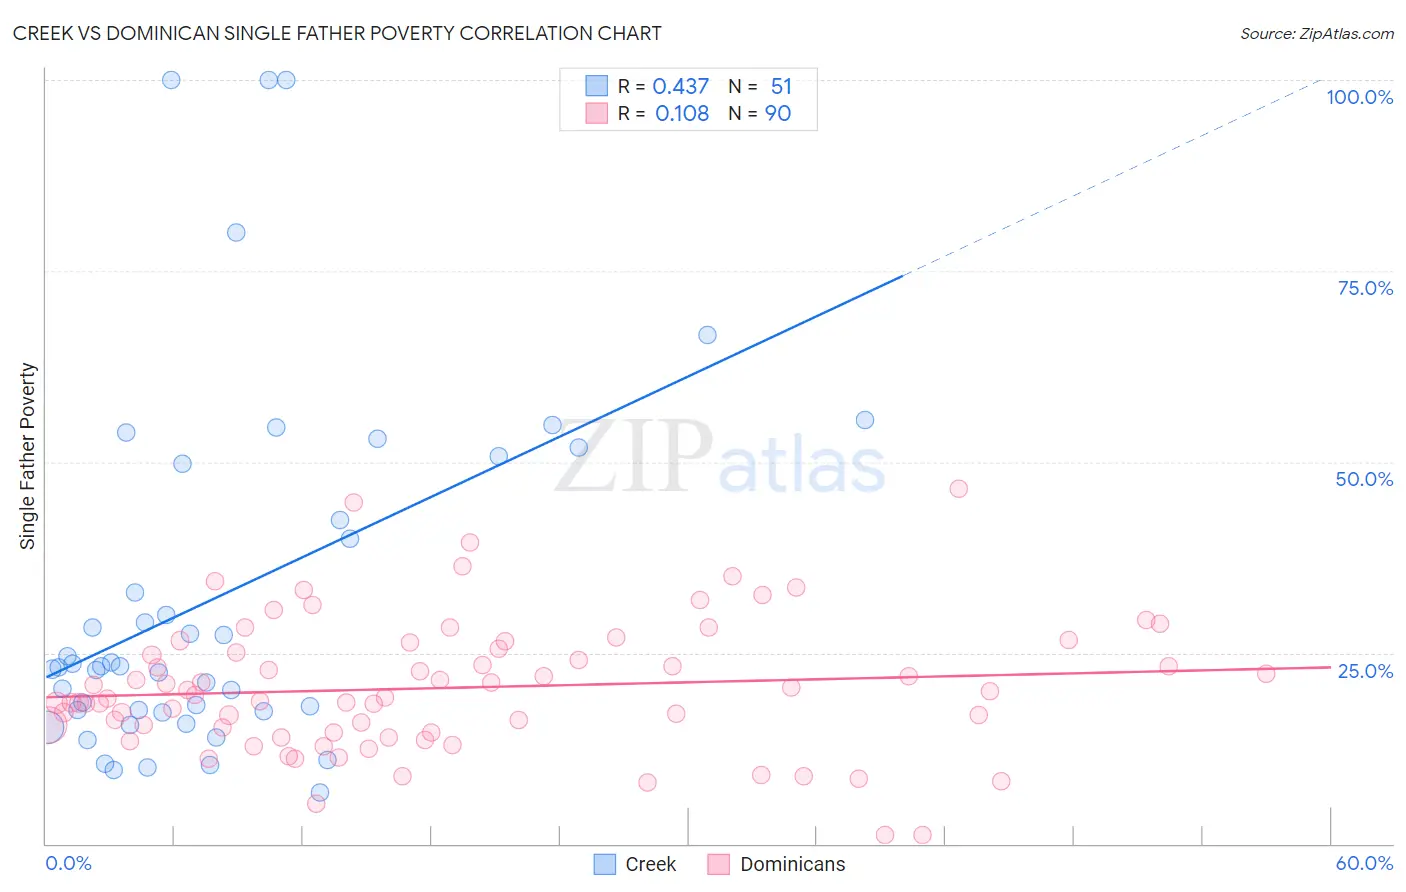
Creek vs Dominican Single Father Poverty Correlation Chart
The statistical analysis conducted on geographies consisting of 156,600,877 people shows a moderate positive correlation between the proportion of Creek and poverty level among single fathers in the United States with a correlation coefficient (R) of 0.437 and weighted average of 19.8%. Similarly, the statistical analysis conducted on geographies consisting of 286,118,760 people shows a poor positive correlation between the proportion of Dominicans and poverty level among single fathers in the United States with a correlation coefficient (R) of 0.108 and weighted average of 19.1%, a difference of 3.9%.
Single Father Poverty Correlation Summary
| Measurement | Creek | Dominican |
| Minimum | 6.7% | 1.2% |
| Maximum | 100.0% | 46.5% |
| Range | 93.3% | 45.2% |
| Mean | 32.5% | 20.4% |
| Median | 23.2% | 19.4% |
| Interquartile 25% (IQ1) | 17.4% | 14.6% |
| Interquartile 75% (IQ3) | 49.8% | 25.5% |
| Interquartile Range (IQR) | 32.4% | 10.9% |
| Standard Deviation (Sample) | 23.7% | 8.6% |
| Standard Deviation (Population) | 23.5% | 8.6% |
Demographics Similar to Creek and Dominicans by Single Father Poverty
In terms of single father poverty, the demographic groups most similar to Creek are Pennsylvania German (20.0%, a difference of 0.90%), Cherokee (19.6%, a difference of 1.0%), American (20.1%, a difference of 1.1%), Inupiat (19.5%, a difference of 1.9%), and Black/African American (20.4%, a difference of 2.7%). Similarly, the demographic groups most similar to Dominicans are Osage (19.0%, a difference of 0.31%), Dutch West Indian (19.2%, a difference of 0.58%), Chickasaw (19.0%, a difference of 0.71%), Delaware (18.9%, a difference of 0.87%), and Potawatomi (18.9%, a difference of 1.0%).
| Demographics | Rating | Rank | Single Father Poverty |
| Immigrants | Micronesia | 0.0 /100 | #309 | Tragic 18.6% |
| Chippewa | 0.0 /100 | #310 | Tragic 18.8% |
| Immigrants | Nonimmigrants | 0.0 /100 | #311 | Tragic 18.8% |
| Immigrants | Dominica | 0.0 /100 | #312 | Tragic 18.9% |
| Potawatomi | 0.0 /100 | #313 | Tragic 18.9% |
| Delaware | 0.0 /100 | #314 | Tragic 18.9% |
| Chickasaw | 0.0 /100 | #315 | Tragic 19.0% |
| Osage | 0.0 /100 | #316 | Tragic 19.0% |
| Dominicans | 0.0 /100 | #317 | Tragic 19.1% |
| Dutch West Indians | 0.0 /100 | #318 | Tragic 19.2% |
| Slovaks | 0.0 /100 | #319 | Tragic 19.3% |
| Inupiat | 0.0 /100 | #320 | Tragic 19.5% |
| Cherokee | 0.0 /100 | #321 | Tragic 19.6% |
| Creek | 0.0 /100 | #322 | Tragic 19.8% |
| Pennsylvania Germans | 0.0 /100 | #323 | Tragic 20.0% |
| Americans | 0.0 /100 | #324 | Tragic 20.1% |
| Blacks/African Americans | 0.0 /100 | #325 | Tragic 20.4% |
| Immigrants | Yemen | 0.0 /100 | #326 | Tragic 20.6% |
| Choctaw | 0.0 /100 | #327 | Tragic 20.7% |
| Pueblo | 0.0 /100 | #328 | Tragic 21.1% |
| Colville | 0.0 /100 | #329 | Tragic 21.4% |