Immigrants from Norway vs Mongolian Median Household Income
COMPARE
Immigrants from Norway
Mongolian
Median Household Income
Median Household Income Comparison
Immigrants from Norway
Mongolians
$94,846
MEDIAN HOUSEHOLD INCOME
99.8/ 100
METRIC RATING
62nd/ 347
METRIC RANK
$93,971
MEDIAN HOUSEHOLD INCOME
99.7/ 100
METRIC RATING
68th/ 347
METRIC RANK
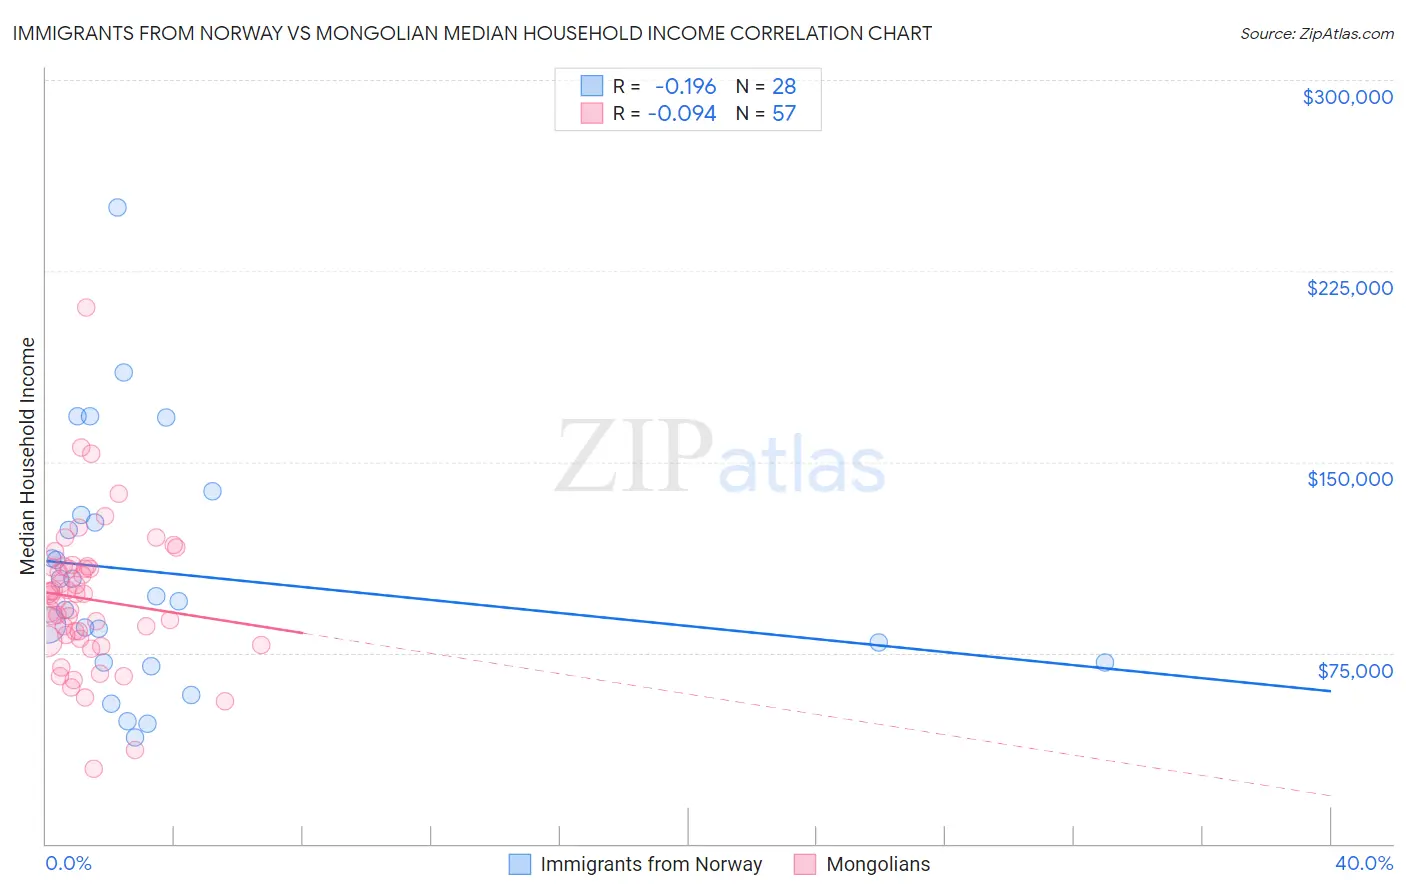
Immigrants from Norway vs Mongolian Median Household Income Correlation Chart
The statistical analysis conducted on geographies consisting of 116,683,199 people shows a poor negative correlation between the proportion of Immigrants from Norway and median household income in the United States with a correlation coefficient (R) of -0.196 and weighted average of $94,846. Similarly, the statistical analysis conducted on geographies consisting of 140,276,403 people shows a slight negative correlation between the proportion of Mongolians and median household income in the United States with a correlation coefficient (R) of -0.094 and weighted average of $93,971, a difference of 0.93%.
Median Household Income Correlation Summary
| Measurement | Immigrants from Norway | Mongolian |
| Minimum | $41,875 | $29,643 |
| Maximum | $250,001 | $210,785 |
| Range | $208,126 | $181,142 |
| Mean | $106,024 | $96,039 |
| Median | $96,218 | $97,648 |
| Interquartile 25% (IQ1) | $71,155 | $79,996 |
| Interquartile 75% (IQ3) | $127,785 | $108,680 |
| Interquartile Range (IQR) | $56,630 | $28,684 |
| Standard Deviation (Sample) | $48,243 | $28,830 |
| Standard Deviation (Population) | $47,374 | $28,576 |
Demographics Similar to Immigrants from Norway and Mongolians by Median Household Income
In terms of median household income, the demographic groups most similar to Immigrants from Norway are Greek ($94,735, a difference of 0.12%), Laotian ($94,990, a difference of 0.15%), Korean ($95,018, a difference of 0.18%), Immigrants from Europe ($95,032, a difference of 0.20%), and Soviet Union ($95,098, a difference of 0.27%). Similarly, the demographic groups most similar to Mongolians are Argentinean ($93,960, a difference of 0.010%), Immigrants from Fiji ($93,933, a difference of 0.040%), Immigrants from Philippines ($93,899, a difference of 0.080%), Immigrants from Scotland ($94,091, a difference of 0.13%), and Lithuanian ($93,852, a difference of 0.13%).
| Demographics | Rating | Rank | Median Household Income |
| Immigrants | Czechoslovakia | 99.9 /100 | #55 | Exceptional $95,319 |
| Immigrants | Austria | 99.9 /100 | #56 | Exceptional $95,277 |
| New Zealanders | 99.8 /100 | #57 | Exceptional $95,146 |
| Soviet Union | 99.8 /100 | #58 | Exceptional $95,098 |
| Immigrants | Europe | 99.8 /100 | #59 | Exceptional $95,032 |
| Koreans | 99.8 /100 | #60 | Exceptional $95,018 |
| Laotians | 99.8 /100 | #61 | Exceptional $94,990 |
| Immigrants | Norway | 99.8 /100 | #62 | Exceptional $94,846 |
| Greeks | 99.8 /100 | #63 | Exceptional $94,735 |
| Immigrants | Netherlands | 99.7 /100 | #64 | Exceptional $94,411 |
| Immigrants | Belarus | 99.7 /100 | #65 | Exceptional $94,399 |
| Immigrants | Romania | 99.7 /100 | #66 | Exceptional $94,222 |
| Immigrants | Scotland | 99.7 /100 | #67 | Exceptional $94,091 |
| Mongolians | 99.7 /100 | #68 | Exceptional $93,971 |
| Argentineans | 99.7 /100 | #69 | Exceptional $93,960 |
| Immigrants | Fiji | 99.7 /100 | #70 | Exceptional $93,933 |
| Immigrants | Philippines | 99.6 /100 | #71 | Exceptional $93,899 |
| Lithuanians | 99.6 /100 | #72 | Exceptional $93,852 |
| Immigrants | Egypt | 99.6 /100 | #73 | Exceptional $93,700 |
| Immigrants | Latvia | 99.6 /100 | #74 | Exceptional $93,602 |
| Immigrants | Italy | 99.5 /100 | #75 | Exceptional $93,465 |