Immigrants from Norway vs European Currently Married
COMPARE
Immigrants from Norway
European
Currently Married
Currently Married Comparison
Immigrants from Norway
Europeans
47.2%
CURRENTLY MARRIED
79.7/ 100
METRIC RATING
135th/ 347
METRIC RANK
49.3%
CURRENTLY MARRIED
99.8/ 100
METRIC RATING
19th/ 347
METRIC RANK
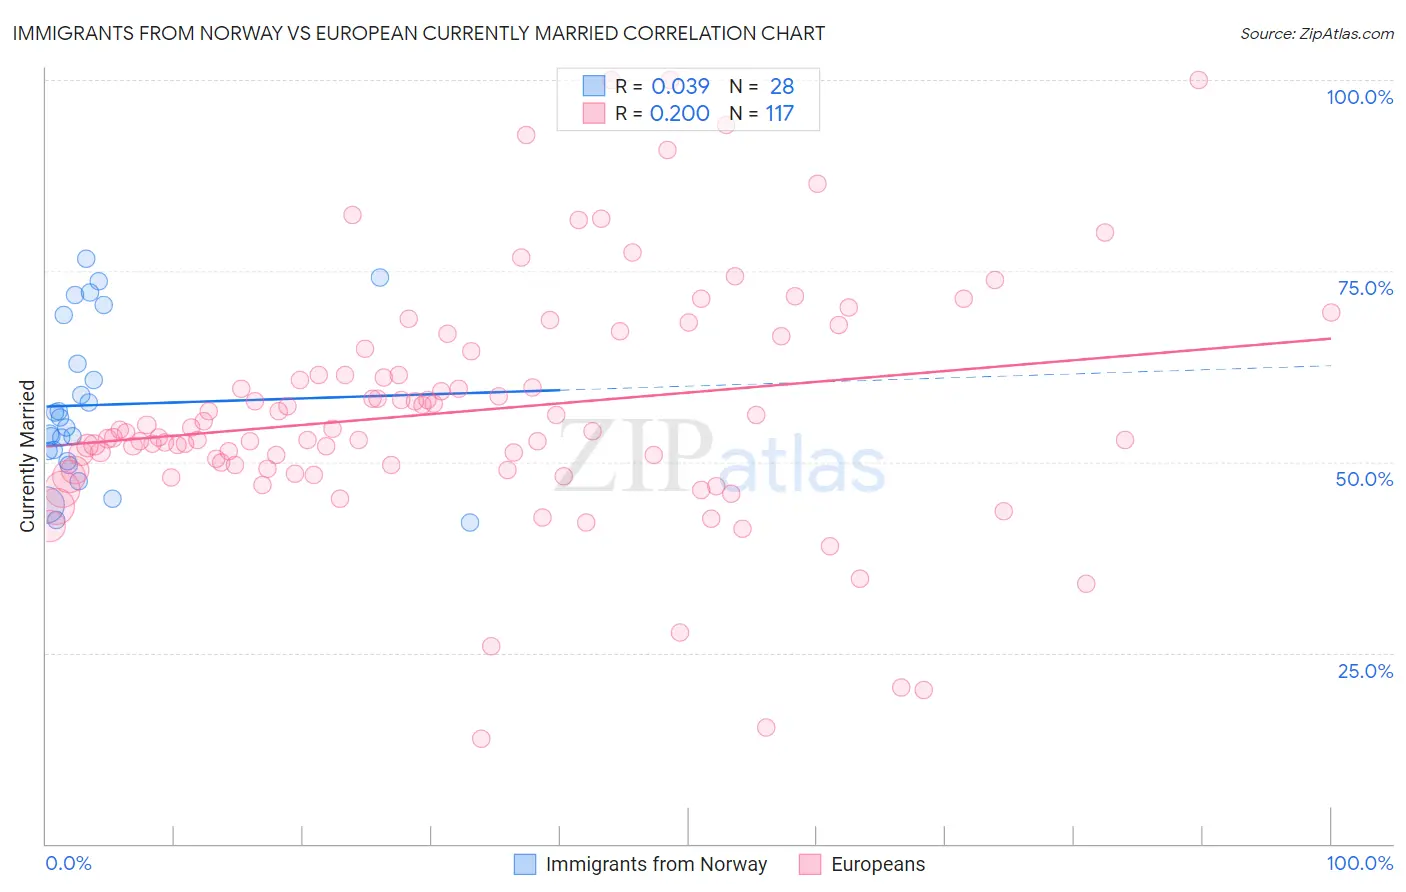
Immigrants from Norway vs European Currently Married Correlation Chart
The statistical analysis conducted on geographies consisting of 116,715,182 people shows no correlation between the proportion of Immigrants from Norway and percentage of population currently married in the United States with a correlation coefficient (R) of 0.039 and weighted average of 47.2%. Similarly, the statistical analysis conducted on geographies consisting of 561,708,680 people shows a poor positive correlation between the proportion of Europeans and percentage of population currently married in the United States with a correlation coefficient (R) of 0.200 and weighted average of 49.3%, a difference of 4.5%.
Currently Married Correlation Summary
| Measurement | Immigrants from Norway | European |
| Minimum | 42.0% | 13.8% |
| Maximum | 76.6% | 100.0% |
| Range | 34.6% | 86.2% |
| Mean | 57.5% | 56.7% |
| Median | 55.2% | 53.8% |
| Interquartile 25% (IQ1) | 50.8% | 49.0% |
| Interquartile 75% (IQ3) | 66.0% | 62.9% |
| Interquartile Range (IQR) | 15.3% | 13.9% |
| Standard Deviation (Sample) | 10.2% | 15.8% |
| Standard Deviation (Population) | 10.1% | 15.7% |
Similar Demographics by Currently Married
Demographics Similar to Immigrants from Norway by Currently Married
In terms of currently married, the demographic groups most similar to Immigrants from Norway are Immigrants from Malaysia (47.3%, a difference of 0.080%), Immigrants from Australia (47.3%, a difference of 0.080%), Immigrants from Vietnam (47.2%, a difference of 0.080%), Paraguayan (47.2%, a difference of 0.10%), and Pakistani (47.2%, a difference of 0.12%).
| Demographics | Rating | Rank | Currently Married |
| Portuguese | 84.2 /100 | #128 | Excellent 47.3% |
| Sri Lankans | 83.2 /100 | #129 | Excellent 47.3% |
| Immigrants | Iraq | 82.8 /100 | #130 | Excellent 47.3% |
| Icelanders | 82.4 /100 | #131 | Excellent 47.3% |
| Afghans | 81.8 /100 | #132 | Excellent 47.3% |
| Immigrants | Malaysia | 81.1 /100 | #133 | Excellent 47.3% |
| Immigrants | Australia | 81.1 /100 | #134 | Excellent 47.3% |
| Immigrants | Norway | 79.7 /100 | #135 | Good 47.2% |
| Immigrants | Vietnam | 78.2 /100 | #136 | Good 47.2% |
| Paraguayans | 77.8 /100 | #137 | Good 47.2% |
| Pakistanis | 77.5 /100 | #138 | Good 47.2% |
| Yugoslavians | 77.4 /100 | #139 | Good 47.2% |
| Cajuns | 75.3 /100 | #140 | Good 47.1% |
| Venezuelans | 74.4 /100 | #141 | Good 47.1% |
| Argentineans | 74.4 /100 | #142 | Good 47.1% |
Demographics Similar to Europeans by Currently Married
In terms of currently married, the demographic groups most similar to Europeans are Immigrants from Scotland (49.3%, a difference of 0.020%), Luxembourger (49.3%, a difference of 0.14%), Scottish (49.2%, a difference of 0.24%), Scandinavian (49.5%, a difference of 0.31%), and Chinese (49.5%, a difference of 0.33%).
| Demographics | Rating | Rank | Currently Married |
| Swiss | 99.9 /100 | #12 | Exceptional 49.7% |
| Dutch | 99.9 /100 | #13 | Exceptional 49.6% |
| Germans | 99.9 /100 | #14 | Exceptional 49.6% |
| Pennsylvania Germans | 99.9 /100 | #15 | Exceptional 49.6% |
| Chinese | 99.9 /100 | #16 | Exceptional 49.5% |
| Scandinavians | 99.9 /100 | #17 | Exceptional 49.5% |
| Immigrants | Scotland | 99.8 /100 | #18 | Exceptional 49.3% |
| Europeans | 99.8 /100 | #19 | Exceptional 49.3% |
| Luxembourgers | 99.8 /100 | #20 | Exceptional 49.3% |
| Scottish | 99.8 /100 | #21 | Exceptional 49.2% |
| Bulgarians | 99.7 /100 | #22 | Exceptional 49.1% |
| Immigrants | Pakistan | 99.7 /100 | #23 | Exceptional 49.1% |
| Lithuanians | 99.6 /100 | #24 | Exceptional 49.0% |
| Maltese | 99.6 /100 | #25 | Exceptional 49.0% |
| Immigrants | Korea | 99.6 /100 | #26 | Exceptional 49.0% |