Immigrants from Norway vs Czech Receiving Food Stamps
COMPARE
Immigrants from Norway
Czech
Receiving Food Stamps
Receiving Food Stamps Comparison
Immigrants from Norway
Czechs
10.0%
RECEIVING FOOD STAMPS
98.4/ 100
METRIC RATING
86th/ 347
METRIC RANK
9.2%
RECEIVING FOOD STAMPS
99.8/ 100
METRIC RATING
28th/ 347
METRIC RANK
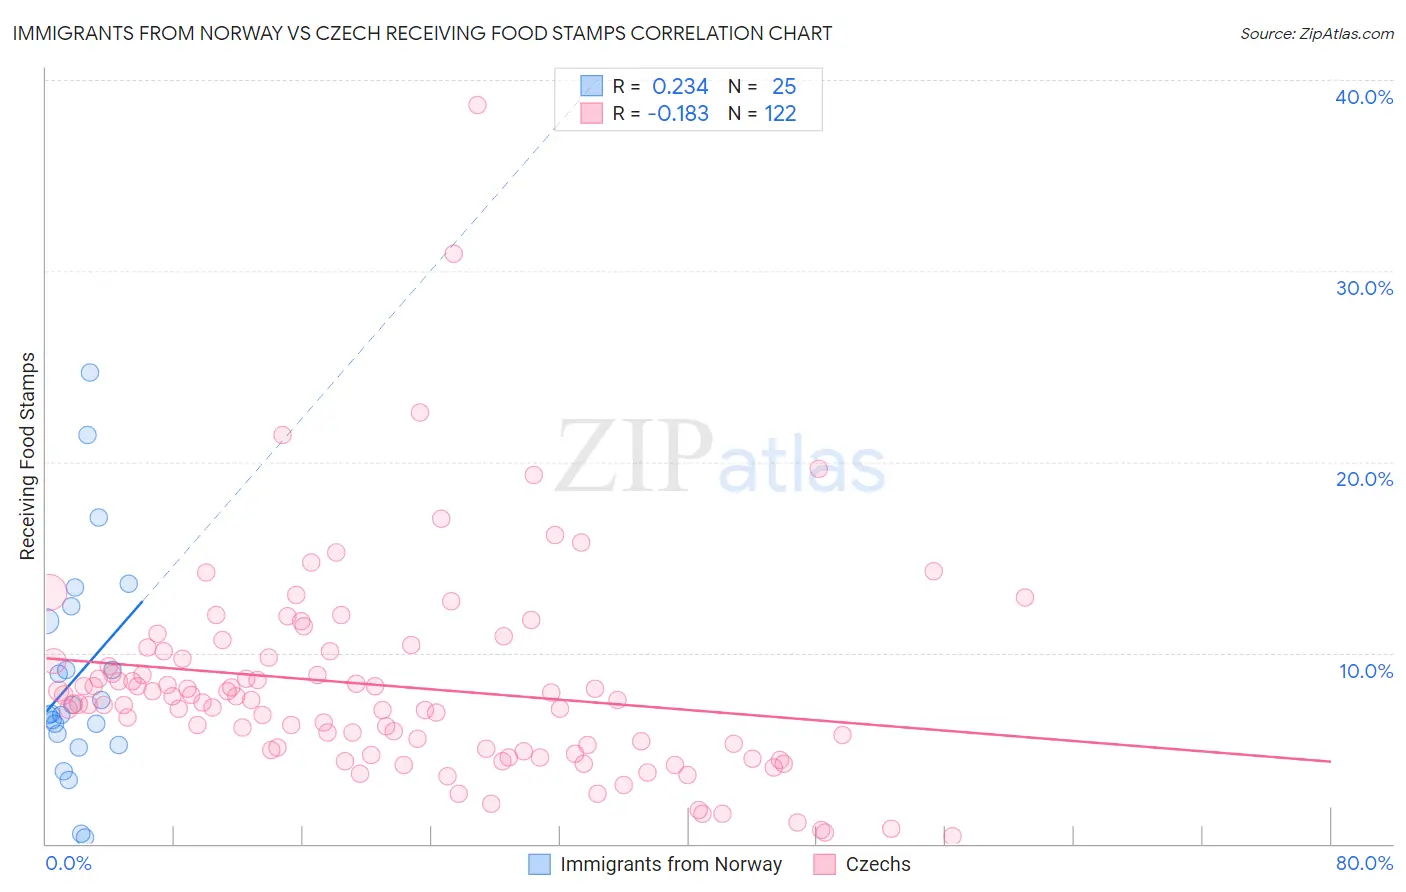
Immigrants from Norway vs Czech Receiving Food Stamps Correlation Chart
The statistical analysis conducted on geographies consisting of 116,612,325 people shows a weak positive correlation between the proportion of Immigrants from Norway and percentage of population receiving government assistance and/or food stamps in the United States with a correlation coefficient (R) of 0.234 and weighted average of 10.0%. Similarly, the statistical analysis conducted on geographies consisting of 482,652,589 people shows a poor negative correlation between the proportion of Czechs and percentage of population receiving government assistance and/or food stamps in the United States with a correlation coefficient (R) of -0.183 and weighted average of 9.2%, a difference of 8.9%.
Receiving Food Stamps Correlation Summary
| Measurement | Immigrants from Norway | Czech |
| Minimum | 0.30% | 0.40% |
| Maximum | 24.7% | 38.7% |
| Range | 24.4% | 38.3% |
| Mean | 8.8% | 8.3% |
| Median | 6.8% | 7.5% |
| Interquartile 25% (IQ1) | 5.5% | 4.9% |
| Interquartile 75% (IQ3) | 12.0% | 9.7% |
| Interquartile Range (IQR) | 6.6% | 4.8% |
| Standard Deviation (Sample) | 5.8% | 5.5% |
| Standard Deviation (Population) | 5.7% | 5.4% |
Similar Demographics by Receiving Food Stamps
Demographics Similar to Immigrants from Norway by Receiving Food Stamps
In terms of receiving food stamps, the demographic groups most similar to Immigrants from Norway are Egyptian (10.0%, a difference of 0.030%), Immigrants from Kuwait (10.0%, a difference of 0.090%), Immigrants from Romania (10.0%, a difference of 0.10%), Immigrants from Israel (10.0%, a difference of 0.27%), and Immigrants from France (10.1%, a difference of 0.34%).
| Demographics | Rating | Rank | Receiving Food Stamps |
| Laotians | 98.7 /100 | #79 | Exceptional 10.0% |
| Poles | 98.6 /100 | #80 | Exceptional 10.0% |
| Immigrants | England | 98.6 /100 | #81 | Exceptional 10.0% |
| Austrians | 98.6 /100 | #82 | Exceptional 10.0% |
| Dutch | 98.6 /100 | #83 | Exceptional 10.0% |
| Immigrants | Israel | 98.5 /100 | #84 | Exceptional 10.0% |
| Immigrants | Romania | 98.5 /100 | #85 | Exceptional 10.0% |
| Immigrants | Norway | 98.4 /100 | #86 | Exceptional 10.0% |
| Egyptians | 98.4 /100 | #87 | Exceptional 10.0% |
| Immigrants | Kuwait | 98.4 /100 | #88 | Exceptional 10.0% |
| Immigrants | France | 98.3 /100 | #89 | Exceptional 10.1% |
| Finns | 97.9 /100 | #90 | Exceptional 10.2% |
| Jordanians | 97.9 /100 | #91 | Exceptional 10.2% |
| Irish | 97.9 /100 | #92 | Exceptional 10.2% |
| Belgians | 97.7 /100 | #93 | Exceptional 10.2% |
Demographics Similar to Czechs by Receiving Food Stamps
In terms of receiving food stamps, the demographic groups most similar to Czechs are Bhutanese (9.2%, a difference of 0.010%), Swedish (9.2%, a difference of 0.25%), Immigrants from Lithuania (9.2%, a difference of 0.27%), Immigrants from Ireland (9.2%, a difference of 0.45%), and Immigrants from Northern Europe (9.2%, a difference of 0.55%).
| Demographics | Rating | Rank | Receiving Food Stamps |
| Luxembourgers | 99.8 /100 | #21 | Exceptional 9.1% |
| Immigrants | Australia | 99.8 /100 | #22 | Exceptional 9.2% |
| Eastern Europeans | 99.8 /100 | #23 | Exceptional 9.2% |
| Immigrants | Northern Europe | 99.8 /100 | #24 | Exceptional 9.2% |
| Immigrants | Ireland | 99.8 /100 | #25 | Exceptional 9.2% |
| Swedes | 99.8 /100 | #26 | Exceptional 9.2% |
| Bhutanese | 99.8 /100 | #27 | Exceptional 9.2% |
| Czechs | 99.8 /100 | #28 | Exceptional 9.2% |
| Immigrants | Lithuania | 99.8 /100 | #29 | Exceptional 9.2% |
| Immigrants | Sweden | 99.7 /100 | #30 | Exceptional 9.3% |
| Immigrants | Eastern Asia | 99.7 /100 | #31 | Exceptional 9.3% |
| Bolivians | 99.7 /100 | #32 | Exceptional 9.3% |
| Zimbabweans | 99.6 /100 | #33 | Exceptional 9.5% |
| Turks | 99.6 /100 | #34 | Exceptional 9.5% |
| Immigrants | Austria | 99.6 /100 | #35 | Exceptional 9.5% |