Immigrants from Norway vs Iraqi Receiving Food Stamps
COMPARE
Immigrants from Norway
Iraqi
Receiving Food Stamps
Receiving Food Stamps Comparison
Immigrants from Norway
Iraqis
10.0%
RECEIVING FOOD STAMPS
98.4/ 100
METRIC RATING
86th/ 347
METRIC RANK
12.2%
RECEIVING FOOD STAMPS
26.6/ 100
METRIC RATING
196th/ 347
METRIC RANK
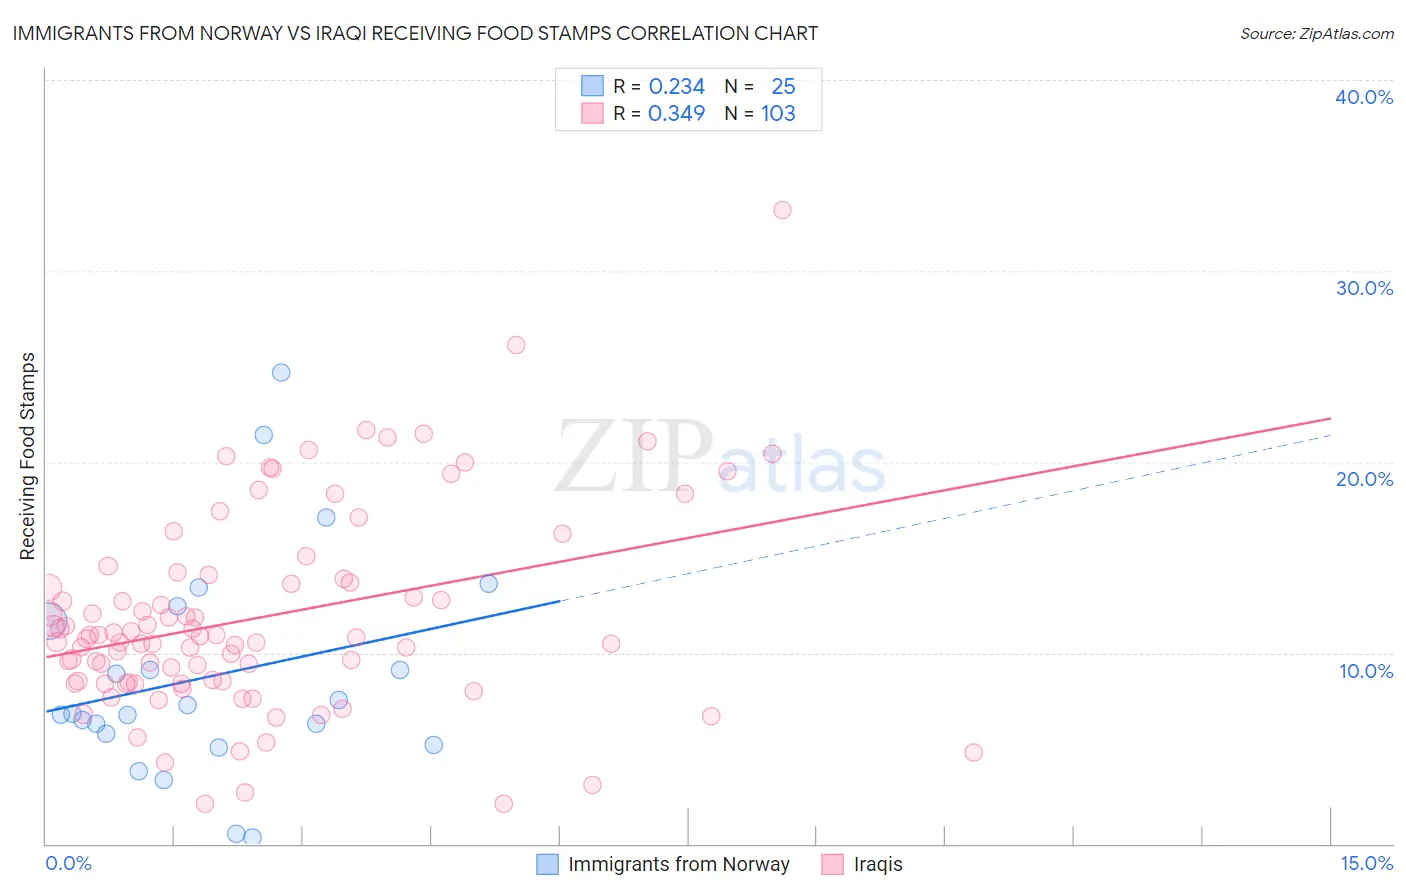
Immigrants from Norway vs Iraqi Receiving Food Stamps Correlation Chart
The statistical analysis conducted on geographies consisting of 116,612,325 people shows a weak positive correlation between the proportion of Immigrants from Norway and percentage of population receiving government assistance and/or food stamps in the United States with a correlation coefficient (R) of 0.234 and weighted average of 10.0%. Similarly, the statistical analysis conducted on geographies consisting of 170,465,445 people shows a mild positive correlation between the proportion of Iraqis and percentage of population receiving government assistance and/or food stamps in the United States with a correlation coefficient (R) of 0.349 and weighted average of 12.2%, a difference of 21.1%.
Receiving Food Stamps Correlation Summary
| Measurement | Immigrants from Norway | Iraqi |
| Minimum | 0.30% | 2.1% |
| Maximum | 24.7% | 33.2% |
| Range | 24.4% | 31.1% |
| Mean | 8.8% | 11.8% |
| Median | 6.8% | 10.8% |
| Interquartile 25% (IQ1) | 5.5% | 8.4% |
| Interquartile 75% (IQ3) | 12.0% | 13.9% |
| Interquartile Range (IQR) | 6.6% | 5.5% |
| Standard Deviation (Sample) | 5.8% | 5.3% |
| Standard Deviation (Population) | 5.7% | 5.2% |
Similar Demographics by Receiving Food Stamps
Demographics Similar to Immigrants from Norway by Receiving Food Stamps
In terms of receiving food stamps, the demographic groups most similar to Immigrants from Norway are Egyptian (10.0%, a difference of 0.030%), Immigrants from Kuwait (10.0%, a difference of 0.090%), Immigrants from Romania (10.0%, a difference of 0.10%), Immigrants from Israel (10.0%, a difference of 0.27%), and Immigrants from France (10.1%, a difference of 0.34%).
| Demographics | Rating | Rank | Receiving Food Stamps |
| Laotians | 98.7 /100 | #79 | Exceptional 10.0% |
| Poles | 98.6 /100 | #80 | Exceptional 10.0% |
| Immigrants | England | 98.6 /100 | #81 | Exceptional 10.0% |
| Austrians | 98.6 /100 | #82 | Exceptional 10.0% |
| Dutch | 98.6 /100 | #83 | Exceptional 10.0% |
| Immigrants | Israel | 98.5 /100 | #84 | Exceptional 10.0% |
| Immigrants | Romania | 98.5 /100 | #85 | Exceptional 10.0% |
| Immigrants | Norway | 98.4 /100 | #86 | Exceptional 10.0% |
| Egyptians | 98.4 /100 | #87 | Exceptional 10.0% |
| Immigrants | Kuwait | 98.4 /100 | #88 | Exceptional 10.0% |
| Immigrants | France | 98.3 /100 | #89 | Exceptional 10.1% |
| Finns | 97.9 /100 | #90 | Exceptional 10.2% |
| Jordanians | 97.9 /100 | #91 | Exceptional 10.2% |
| Irish | 97.9 /100 | #92 | Exceptional 10.2% |
| Belgians | 97.7 /100 | #93 | Exceptional 10.2% |
Demographics Similar to Iraqis by Receiving Food Stamps
In terms of receiving food stamps, the demographic groups most similar to Iraqis are American (12.2%, a difference of 0.030%), Delaware (12.2%, a difference of 0.080%), Immigrants from Sudan (12.1%, a difference of 0.090%), Immigrants from Fiji (12.1%, a difference of 0.21%), and Immigrants from Costa Rica (12.2%, a difference of 0.21%).
| Demographics | Rating | Rank | Receiving Food Stamps |
| Immigrants | Cameroon | 32.5 /100 | #189 | Fair 12.0% |
| Immigrants | Peru | 32.2 /100 | #190 | Fair 12.0% |
| Venezuelans | 32.1 /100 | #191 | Fair 12.0% |
| Samoans | 31.0 /100 | #192 | Fair 12.1% |
| Immigrants | Fiji | 27.8 /100 | #193 | Fair 12.1% |
| Immigrants | Sudan | 27.1 /100 | #194 | Fair 12.1% |
| Americans | 26.7 /100 | #195 | Fair 12.2% |
| Iraqis | 26.6 /100 | #196 | Fair 12.2% |
| Delaware | 26.1 /100 | #197 | Fair 12.2% |
| Immigrants | Costa Rica | 25.4 /100 | #198 | Fair 12.2% |
| Portuguese | 25.1 /100 | #199 | Fair 12.2% |
| Sierra Leoneans | 23.6 /100 | #200 | Fair 12.2% |
| Ugandans | 22.5 /100 | #201 | Fair 12.2% |
| Immigrants | Venezuela | 20.1 /100 | #202 | Fair 12.3% |
| Shoshone | 17.7 /100 | #203 | Poor 12.4% |