Immigrants from Norway vs Czech Disability Age Over 75
COMPARE
Immigrants from Norway
Czech
Disability Age Over 75
Disability Age Over 75 Comparison
Immigrants from Norway
Czechs
45.9%
DISABILITY AGE OVER 75
99.5/ 100
METRIC RATING
63rd/ 347
METRIC RANK
45.7%
DISABILITY AGE OVER 75
99.8/ 100
METRIC RATING
43rd/ 347
METRIC RANK
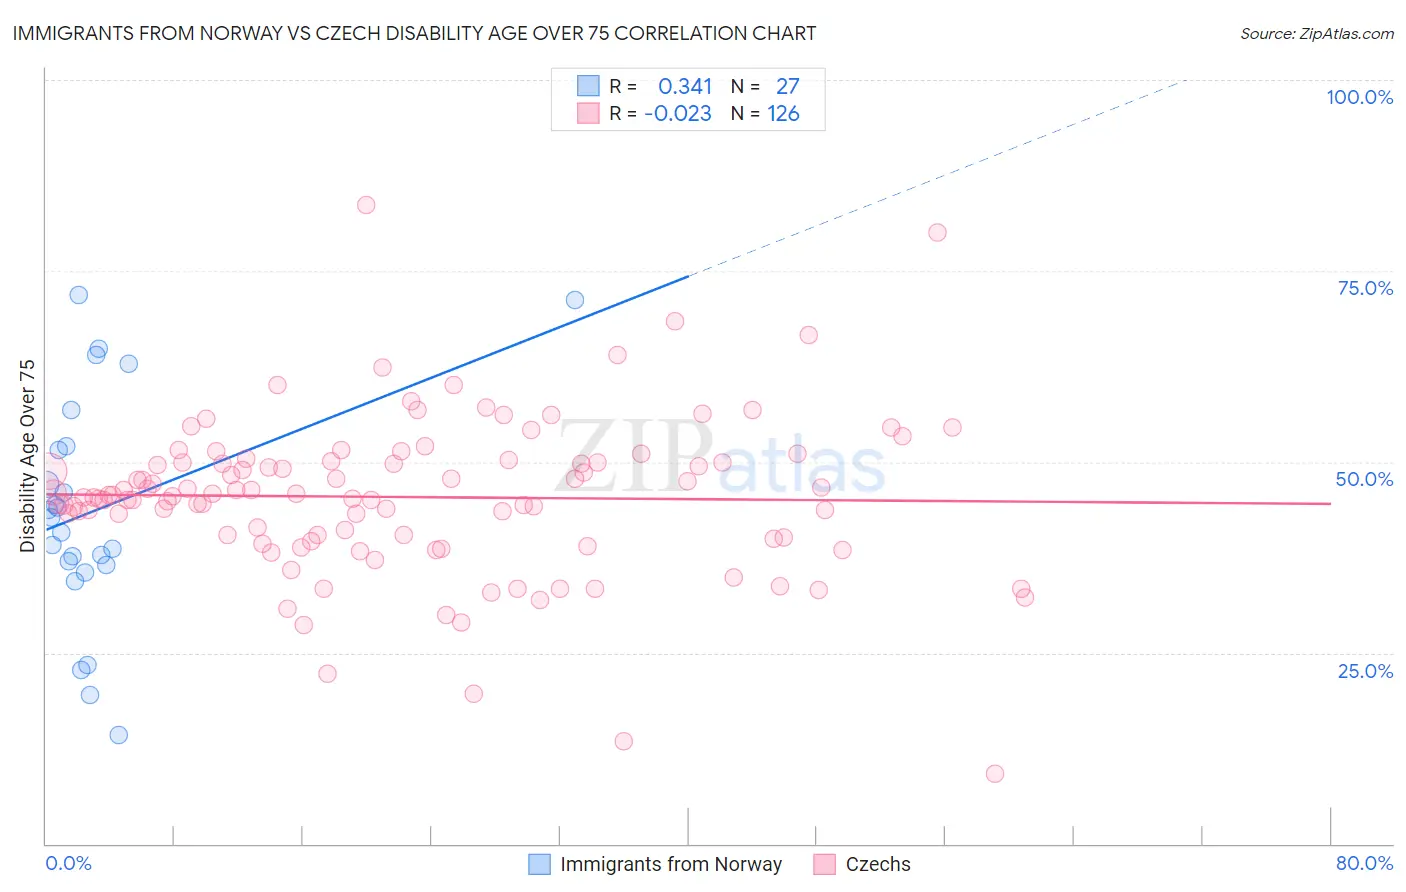
Immigrants from Norway vs Czech Disability Age Over 75 Correlation Chart
The statistical analysis conducted on geographies consisting of 116,660,458 people shows a mild positive correlation between the proportion of Immigrants from Norway and percentage of population with a disability over the age of 75 in the United States with a correlation coefficient (R) of 0.341 and weighted average of 45.9%. Similarly, the statistical analysis conducted on geographies consisting of 483,617,393 people shows no correlation between the proportion of Czechs and percentage of population with a disability over the age of 75 in the United States with a correlation coefficient (R) of -0.023 and weighted average of 45.7%, a difference of 0.62%.
Disability Age Over 75 Correlation Summary
| Measurement | Immigrants from Norway | Czech |
| Minimum | 14.3% | 9.1% |
| Maximum | 71.9% | 83.6% |
| Range | 57.6% | 74.6% |
| Mean | 43.7% | 45.4% |
| Median | 42.7% | 45.6% |
| Interquartile 25% (IQ1) | 36.5% | 40.1% |
| Interquartile 75% (IQ3) | 52.0% | 50.0% |
| Interquartile Range (IQR) | 15.5% | 9.9% |
| Standard Deviation (Sample) | 14.9% | 10.4% |
| Standard Deviation (Population) | 14.6% | 10.4% |
Demographics Similar to Immigrants from Norway and Czechs by Disability Age Over 75
In terms of disability age over 75, the demographic groups most similar to Immigrants from Norway are Burmese (45.9%, a difference of 0.050%), Immigrants from Argentina (45.9%, a difference of 0.070%), Immigrants from Israel (45.9%, a difference of 0.10%), Iranian (45.9%, a difference of 0.10%), and Immigrants from Europe (45.9%, a difference of 0.10%). Similarly, the demographic groups most similar to Czechs are Australian (45.7%, a difference of 0.040%), Turkish (45.7%, a difference of 0.040%), Swedish (45.7%, a difference of 0.070%), Immigrants from Canada (45.7%, a difference of 0.080%), and Croatian (45.7%, a difference of 0.090%).
| Demographics | Rating | Rank | Disability Age Over 75 |
| Czechs | 99.8 /100 | #43 | Exceptional 45.7% |
| Australians | 99.8 /100 | #44 | Exceptional 45.7% |
| Turks | 99.8 /100 | #45 | Exceptional 45.7% |
| Swedes | 99.8 /100 | #46 | Exceptional 45.7% |
| Immigrants | Canada | 99.8 /100 | #47 | Exceptional 45.7% |
| Croatians | 99.8 /100 | #48 | Exceptional 45.7% |
| Immigrants | North America | 99.8 /100 | #49 | Exceptional 45.7% |
| Belgians | 99.7 /100 | #50 | Exceptional 45.8% |
| Immigrants | Korea | 99.7 /100 | #51 | Exceptional 45.8% |
| Immigrants | France | 99.7 /100 | #52 | Exceptional 45.8% |
| Immigrants | Italy | 99.7 /100 | #53 | Exceptional 45.8% |
| Slovaks | 99.6 /100 | #54 | Exceptional 45.8% |
| Maltese | 99.6 /100 | #55 | Exceptional 45.8% |
| Immigrants | Netherlands | 99.6 /100 | #56 | Exceptional 45.9% |
| Immigrants | Turkey | 99.6 /100 | #57 | Exceptional 45.9% |
| Immigrants | Israel | 99.6 /100 | #58 | Exceptional 45.9% |
| Iranians | 99.6 /100 | #59 | Exceptional 45.9% |
| Immigrants | Europe | 99.6 /100 | #60 | Exceptional 45.9% |
| Immigrants | Argentina | 99.6 /100 | #61 | Exceptional 45.9% |
| Burmese | 99.5 /100 | #62 | Exceptional 45.9% |
| Immigrants | Norway | 99.5 /100 | #63 | Exceptional 45.9% |