Puget Sound Salish vs Czech Receiving Food Stamps
COMPARE
Puget Sound Salish
Czech
Receiving Food Stamps
Receiving Food Stamps Comparison
Puget Sound Salish
Czechs
13.1%
RECEIVING FOOD STAMPS
3.4/ 100
METRIC RATING
230th/ 347
METRIC RANK
9.2%
RECEIVING FOOD STAMPS
99.8/ 100
METRIC RATING
28th/ 347
METRIC RANK
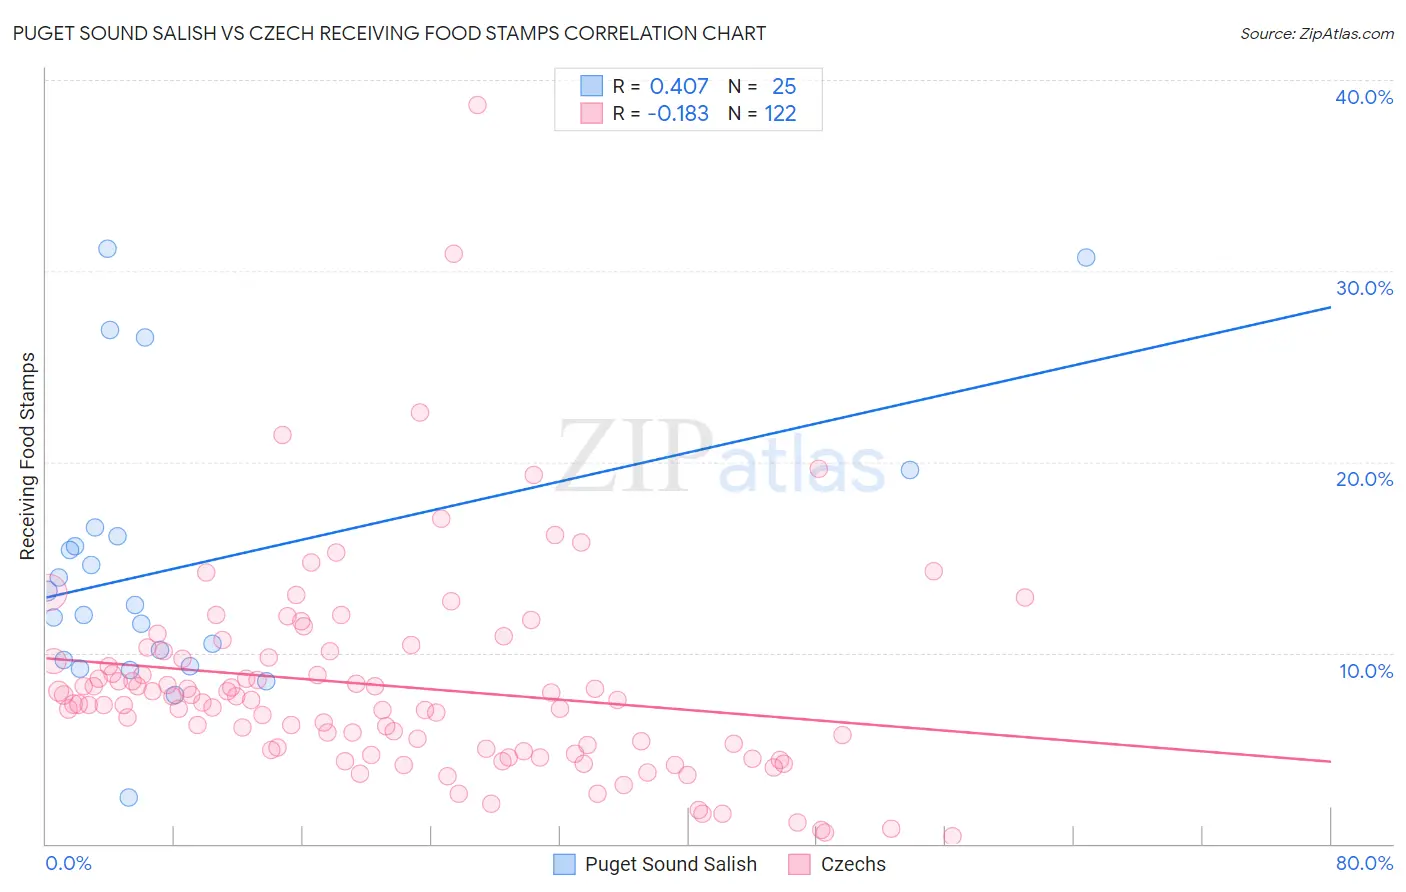
Puget Sound Salish vs Czech Receiving Food Stamps Correlation Chart
The statistical analysis conducted on geographies consisting of 46,113,592 people shows a moderate positive correlation between the proportion of Puget Sound Salish and percentage of population receiving government assistance and/or food stamps in the United States with a correlation coefficient (R) of 0.407 and weighted average of 13.1%. Similarly, the statistical analysis conducted on geographies consisting of 482,652,589 people shows a poor negative correlation between the proportion of Czechs and percentage of population receiving government assistance and/or food stamps in the United States with a correlation coefficient (R) of -0.183 and weighted average of 9.2%, a difference of 42.2%.
Receiving Food Stamps Correlation Summary
| Measurement | Puget Sound Salish | Czech |
| Minimum | 2.4% | 0.40% |
| Maximum | 31.1% | 38.7% |
| Range | 28.7% | 38.3% |
| Mean | 14.6% | 8.3% |
| Median | 12.5% | 7.5% |
| Interquartile 25% (IQ1) | 9.5% | 4.9% |
| Interquartile 75% (IQ3) | 16.3% | 9.7% |
| Interquartile Range (IQR) | 6.9% | 4.8% |
| Standard Deviation (Sample) | 7.3% | 5.5% |
| Standard Deviation (Population) | 7.1% | 5.4% |
Similar Demographics by Receiving Food Stamps
Demographics Similar to Puget Sound Salish by Receiving Food Stamps
In terms of receiving food stamps, the demographic groups most similar to Puget Sound Salish are Immigrants from Nigeria (13.1%, a difference of 0.040%), Ottawa (13.1%, a difference of 0.050%), Panamanian (13.1%, a difference of 0.060%), Nigerian (13.1%, a difference of 0.070%), and Chickasaw (13.1%, a difference of 0.12%).
| Demographics | Rating | Rank | Receiving Food Stamps |
| Immigrants | Albania | 4.4 /100 | #223 | Tragic 13.0% |
| Immigrants | Armenia | 4.3 /100 | #224 | Tragic 13.0% |
| Fijians | 4.3 /100 | #225 | Tragic 13.0% |
| Chickasaw | 3.6 /100 | #226 | Tragic 13.1% |
| Nigerians | 3.5 /100 | #227 | Tragic 13.1% |
| Panamanians | 3.5 /100 | #228 | Tragic 13.1% |
| Ottawa | 3.5 /100 | #229 | Tragic 13.1% |
| Puget Sound Salish | 3.4 /100 | #230 | Tragic 13.1% |
| Immigrants | Nigeria | 3.4 /100 | #231 | Tragic 13.1% |
| Salvadorans | 2.7 /100 | #232 | Tragic 13.2% |
| Cherokee | 2.5 /100 | #233 | Tragic 13.2% |
| Comanche | 2.4 /100 | #234 | Tragic 13.3% |
| Immigrants | Zaire | 1.9 /100 | #235 | Tragic 13.4% |
| Crow | 1.6 /100 | #236 | Tragic 13.4% |
| Immigrants | El Salvador | 1.5 /100 | #237 | Tragic 13.5% |
Demographics Similar to Czechs by Receiving Food Stamps
In terms of receiving food stamps, the demographic groups most similar to Czechs are Bhutanese (9.2%, a difference of 0.010%), Swedish (9.2%, a difference of 0.25%), Immigrants from Lithuania (9.2%, a difference of 0.27%), Immigrants from Ireland (9.2%, a difference of 0.45%), and Immigrants from Northern Europe (9.2%, a difference of 0.55%).
| Demographics | Rating | Rank | Receiving Food Stamps |
| Luxembourgers | 99.8 /100 | #21 | Exceptional 9.1% |
| Immigrants | Australia | 99.8 /100 | #22 | Exceptional 9.2% |
| Eastern Europeans | 99.8 /100 | #23 | Exceptional 9.2% |
| Immigrants | Northern Europe | 99.8 /100 | #24 | Exceptional 9.2% |
| Immigrants | Ireland | 99.8 /100 | #25 | Exceptional 9.2% |
| Swedes | 99.8 /100 | #26 | Exceptional 9.2% |
| Bhutanese | 99.8 /100 | #27 | Exceptional 9.2% |
| Czechs | 99.8 /100 | #28 | Exceptional 9.2% |
| Immigrants | Lithuania | 99.8 /100 | #29 | Exceptional 9.2% |
| Immigrants | Sweden | 99.7 /100 | #30 | Exceptional 9.3% |
| Immigrants | Eastern Asia | 99.7 /100 | #31 | Exceptional 9.3% |
| Bolivians | 99.7 /100 | #32 | Exceptional 9.3% |
| Zimbabweans | 99.6 /100 | #33 | Exceptional 9.5% |
| Turks | 99.6 /100 | #34 | Exceptional 9.5% |
| Immigrants | Austria | 99.6 /100 | #35 | Exceptional 9.5% |