Immigrants from Norway vs Creek Child Poverty Among Boys Under 16
COMPARE
Immigrants from Norway
Creek
Child Poverty Among Boys Under 16
Child Poverty Among Boys Under 16 Comparison
Immigrants from Norway
Creek
15.3%
CHILD POVERTY AMONG BOYS UNDER 16
92.3/ 100
METRIC RATING
123rd/ 347
METRIC RANK
21.5%
CHILD POVERTY AMONG BOYS UNDER 16
0.0/ 100
METRIC RATING
310th/ 347
METRIC RANK
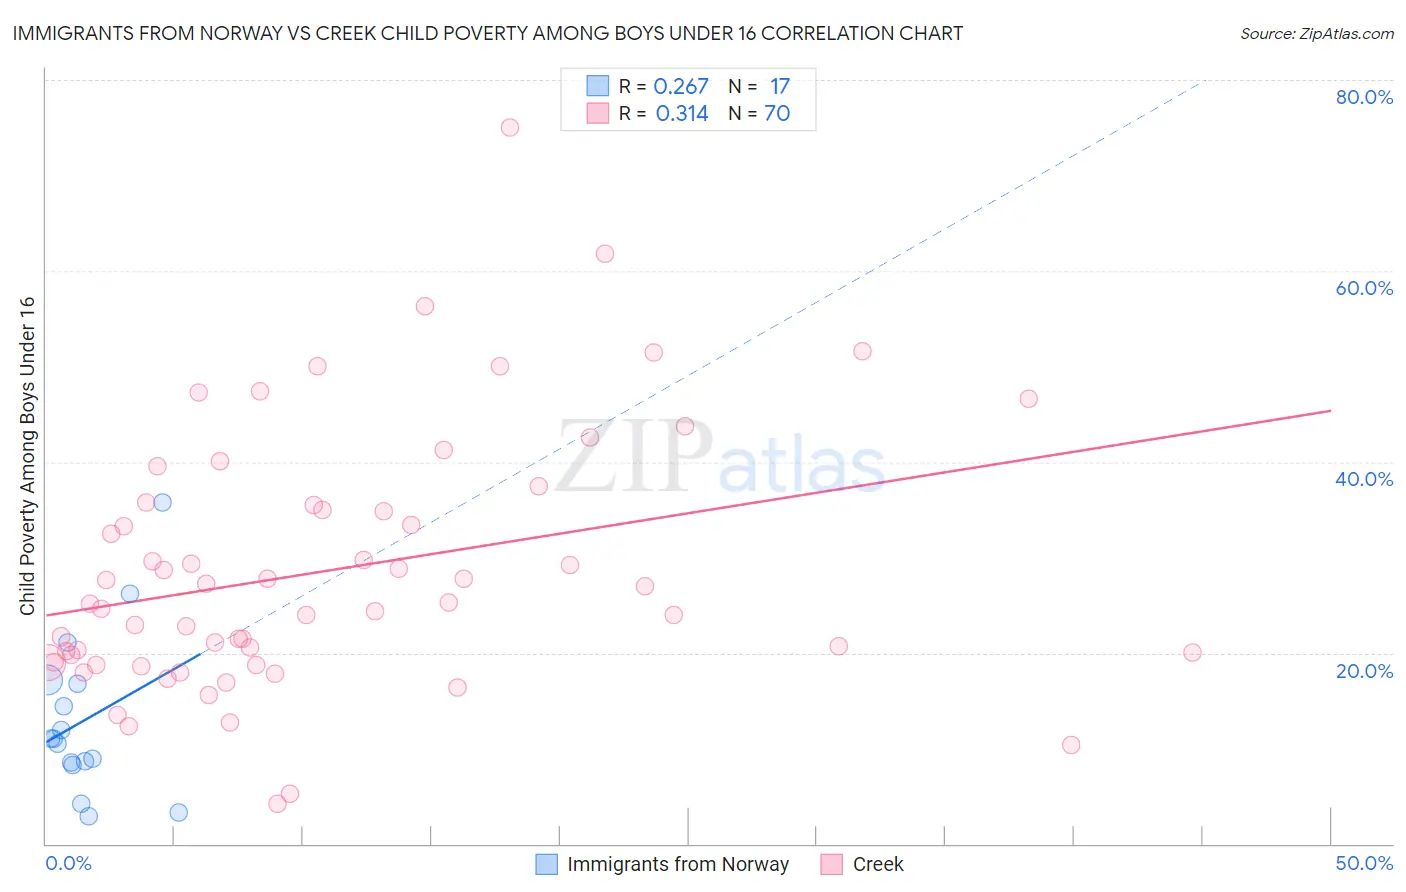
Immigrants from Norway vs Creek Child Poverty Among Boys Under 16 Correlation Chart
The statistical analysis conducted on geographies consisting of 115,648,610 people shows a weak positive correlation between the proportion of Immigrants from Norway and poverty level among boys under the age of 16 in the United States with a correlation coefficient (R) of 0.267 and weighted average of 15.3%. Similarly, the statistical analysis conducted on geographies consisting of 177,656,713 people shows a mild positive correlation between the proportion of Creek and poverty level among boys under the age of 16 in the United States with a correlation coefficient (R) of 0.314 and weighted average of 21.5%, a difference of 40.8%.
Child Poverty Among Boys Under 16 Correlation Summary
| Measurement | Immigrants from Norway | Creek |
| Minimum | 2.9% | 4.2% |
| Maximum | 35.7% | 75.0% |
| Range | 32.8% | 70.8% |
| Mean | 13.0% | 28.7% |
| Median | 11.0% | 25.2% |
| Interquartile 25% (IQ1) | 8.4% | 19.0% |
| Interquartile 75% (IQ3) | 17.0% | 35.5% |
| Interquartile Range (IQR) | 8.6% | 16.5% |
| Standard Deviation (Sample) | 8.5% | 13.5% |
| Standard Deviation (Population) | 8.3% | 13.4% |
Similar Demographics by Child Poverty Among Boys Under 16
Demographics Similar to Immigrants from Norway by Child Poverty Among Boys Under 16
In terms of child poverty among boys under 16, the demographic groups most similar to Immigrants from Norway are Tlingit-Haida (15.3%, a difference of 0.010%), Czechoslovakian (15.3%, a difference of 0.080%), Immigrants from Malaysia (15.3%, a difference of 0.22%), Scottish (15.2%, a difference of 0.32%), and South African (15.2%, a difference of 0.33%).
| Demographics | Rating | Rank | Child Poverty Among Boys Under 16 |
| Immigrants | South Eastern Asia | 93.5 /100 | #116 | Exceptional 15.2% |
| Immigrants | Vietnam | 93.5 /100 | #117 | Exceptional 15.2% |
| Native Hawaiians | 93.4 /100 | #118 | Exceptional 15.2% |
| Belgians | 93.1 /100 | #119 | Exceptional 15.2% |
| South Africans | 93.0 /100 | #120 | Exceptional 15.2% |
| Scottish | 93.0 /100 | #121 | Exceptional 15.2% |
| Immigrants | Malaysia | 92.8 /100 | #122 | Exceptional 15.3% |
| Immigrants | Norway | 92.3 /100 | #123 | Exceptional 15.3% |
| Tlingit-Haida | 92.2 /100 | #124 | Exceptional 15.3% |
| Czechoslovakians | 92.1 /100 | #125 | Exceptional 15.3% |
| Palestinians | 91.3 /100 | #126 | Exceptional 15.4% |
| Carpatho Rusyns | 91.1 /100 | #127 | Exceptional 15.4% |
| Canadians | 90.6 /100 | #128 | Exceptional 15.4% |
| Immigrants | Brazil | 90.3 /100 | #129 | Exceptional 15.4% |
| Mongolians | 90.2 /100 | #130 | Exceptional 15.4% |
Demographics Similar to Creek by Child Poverty Among Boys Under 16
In terms of child poverty among boys under 16, the demographic groups most similar to Creek are Seminole (21.5%, a difference of 0.060%), Bahamian (21.6%, a difference of 0.11%), Immigrants from Guatemala (21.6%, a difference of 0.19%), British West Indian (21.6%, a difference of 0.20%), and Ute (21.6%, a difference of 0.21%).
| Demographics | Rating | Rank | Child Poverty Among Boys Under 16 |
| Immigrants | Haiti | 0.0 /100 | #303 | Tragic 21.3% |
| Immigrants | Central America | 0.0 /100 | #304 | Tragic 21.3% |
| Kiowa | 0.0 /100 | #305 | Tragic 21.3% |
| Immigrants | Grenada | 0.0 /100 | #306 | Tragic 21.3% |
| Choctaw | 0.0 /100 | #307 | Tragic 21.3% |
| Immigrants | Mexico | 0.0 /100 | #308 | Tragic 21.5% |
| Seminole | 0.0 /100 | #309 | Tragic 21.5% |
| Creek | 0.0 /100 | #310 | Tragic 21.5% |
| Bahamians | 0.0 /100 | #311 | Tragic 21.6% |
| Immigrants | Guatemala | 0.0 /100 | #312 | Tragic 21.6% |
| British West Indians | 0.0 /100 | #313 | Tragic 21.6% |
| Ute | 0.0 /100 | #314 | Tragic 21.6% |
| Immigrants | Somalia | 0.0 /100 | #315 | Tragic 21.7% |
| Menominee | 0.0 /100 | #316 | Tragic 21.7% |
| Africans | 0.0 /100 | #317 | Tragic 21.7% |