Immigrants from Northern Africa vs Ukrainian Male Poverty
COMPARE
Immigrants from Northern Africa
Ukrainian
Male Poverty
Male Poverty Comparison
Immigrants from Northern Africa
Ukrainians
11.1%
MALE POVERTY
59.7/ 100
METRIC RATING
161st/ 347
METRIC RANK
10.1%
MALE POVERTY
97.9/ 100
METRIC RATING
60th/ 347
METRIC RANK
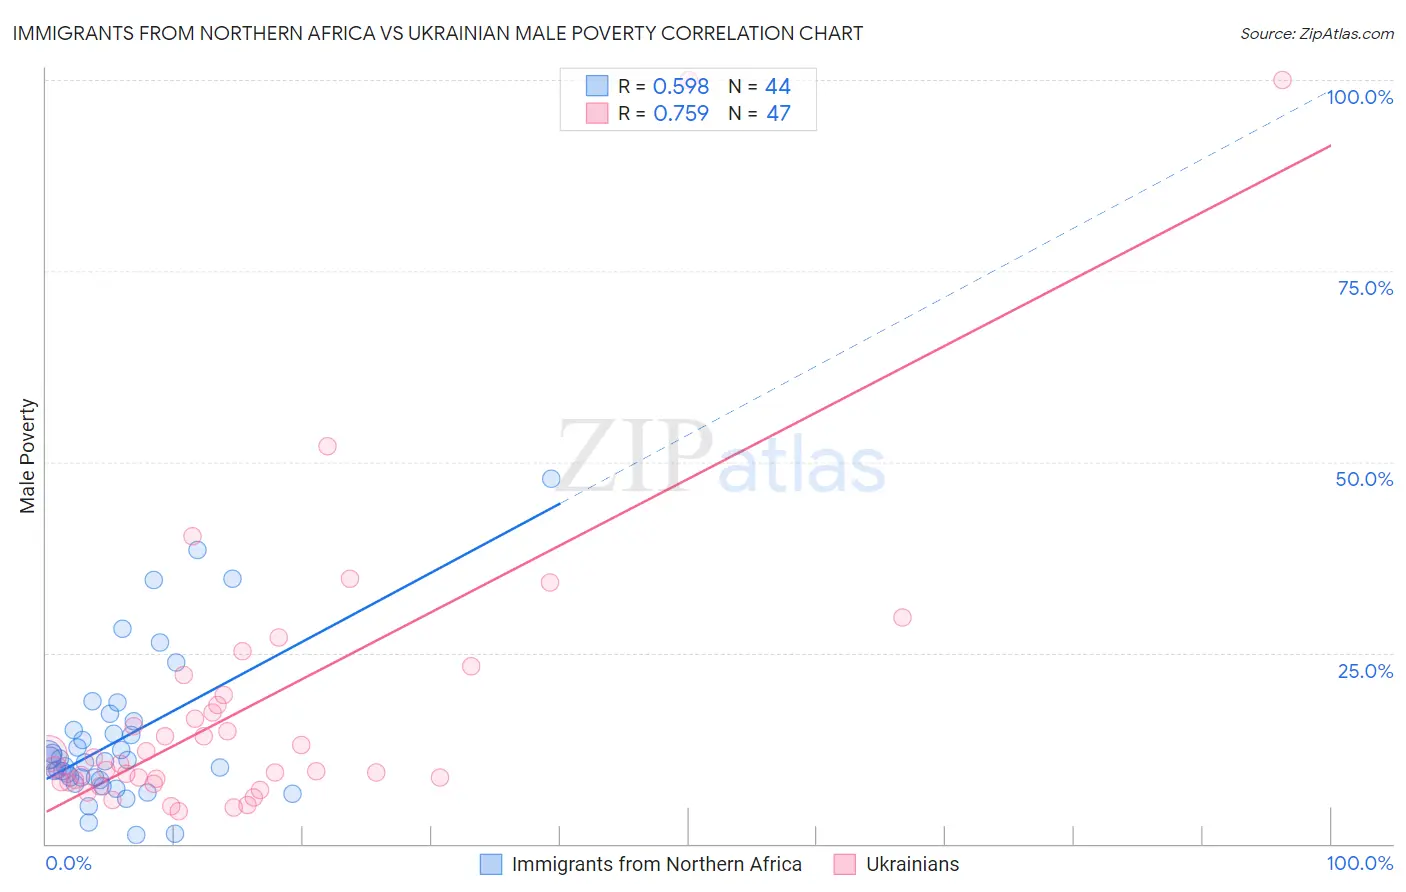
Immigrants from Northern Africa vs Ukrainian Male Poverty Correlation Chart
The statistical analysis conducted on geographies consisting of 320,989,271 people shows a substantial positive correlation between the proportion of Immigrants from Northern Africa and poverty level among males in the United States with a correlation coefficient (R) of 0.598 and weighted average of 11.1%. Similarly, the statistical analysis conducted on geographies consisting of 447,972,433 people shows a strong positive correlation between the proportion of Ukrainians and poverty level among males in the United States with a correlation coefficient (R) of 0.759 and weighted average of 10.1%, a difference of 9.3%.
Male Poverty Correlation Summary
| Measurement | Immigrants from Northern Africa | Ukrainian |
| Minimum | 1.1% | 4.2% |
| Maximum | 47.8% | 100.0% |
| Range | 46.7% | 95.8% |
| Mean | 13.8% | 18.1% |
| Median | 10.9% | 10.5% |
| Interquartile 25% (IQ1) | 8.5% | 8.1% |
| Interquartile 75% (IQ3) | 15.4% | 19.5% |
| Interquartile Range (IQR) | 6.9% | 11.4% |
| Standard Deviation (Sample) | 9.9% | 20.2% |
| Standard Deviation (Population) | 9.8% | 20.0% |
Similar Demographics by Male Poverty
Demographics Similar to Immigrants from Northern Africa by Male Poverty
In terms of male poverty, the demographic groups most similar to Immigrants from Northern Africa are Soviet Union (11.1%, a difference of 0.070%), Immigrants from Chile (11.1%, a difference of 0.23%), White/Caucasian (11.1%, a difference of 0.30%), Ethiopian (11.1%, a difference of 0.30%), and Taiwanese (11.0%, a difference of 0.32%).
| Demographics | Rating | Rank | Male Poverty |
| Immigrants | Kazakhstan | 64.8 /100 | #154 | Good 11.0% |
| Immigrants | Malaysia | 64.7 /100 | #155 | Good 11.0% |
| Costa Ricans | 63.9 /100 | #156 | Good 11.0% |
| Scotch-Irish | 63.7 /100 | #157 | Good 11.0% |
| Colombians | 63.0 /100 | #158 | Good 11.0% |
| Taiwanese | 62.7 /100 | #159 | Good 11.0% |
| Soviet Union | 60.3 /100 | #160 | Good 11.1% |
| Immigrants | Northern Africa | 59.7 /100 | #161 | Average 11.1% |
| Immigrants | Chile | 57.4 /100 | #162 | Average 11.1% |
| Whites/Caucasians | 56.7 /100 | #163 | Average 11.1% |
| Ethiopians | 56.7 /100 | #164 | Average 11.1% |
| Immigrants | Spain | 55.5 /100 | #165 | Average 11.1% |
| Immigrants | Albania | 55.3 /100 | #166 | Average 11.1% |
| Hungarians | 55.1 /100 | #167 | Average 11.1% |
| Immigrants | Portugal | 54.9 /100 | #168 | Average 11.1% |
Demographics Similar to Ukrainians by Male Poverty
In terms of male poverty, the demographic groups most similar to Ukrainians are Austrian (10.1%, a difference of 0.020%), Immigrants from Europe (10.1%, a difference of 0.090%), Immigrants from Italy (10.2%, a difference of 0.11%), Slovak (10.2%, a difference of 0.15%), and Scandinavian (10.1%, a difference of 0.22%).
| Demographics | Rating | Rank | Male Poverty |
| Immigrants | Czechoslovakia | 98.6 /100 | #53 | Exceptional 10.0% |
| Immigrants | Austria | 98.5 /100 | #54 | Exceptional 10.0% |
| Germans | 98.3 /100 | #55 | Exceptional 10.1% |
| Immigrants | Bulgaria | 98.2 /100 | #56 | Exceptional 10.1% |
| Estonians | 98.1 /100 | #57 | Exceptional 10.1% |
| Scandinavians | 98.0 /100 | #58 | Exceptional 10.1% |
| Immigrants | Europe | 97.9 /100 | #59 | Exceptional 10.1% |
| Ukrainians | 97.9 /100 | #60 | Exceptional 10.1% |
| Austrians | 97.8 /100 | #61 | Exceptional 10.1% |
| Immigrants | Italy | 97.8 /100 | #62 | Exceptional 10.2% |
| Slovaks | 97.7 /100 | #63 | Exceptional 10.2% |
| Swiss | 97.5 /100 | #64 | Exceptional 10.2% |
| Zimbabweans | 97.5 /100 | #65 | Exceptional 10.2% |
| Serbians | 97.5 /100 | #66 | Exceptional 10.2% |
| Immigrants | Netherlands | 97.3 /100 | #67 | Exceptional 10.2% |