Immigrants from Barbados vs Ukrainian Male Poverty
COMPARE
Immigrants from Barbados
Ukrainian
Male Poverty
Male Poverty Comparison
Immigrants from Barbados
Ukrainians
13.8%
MALE POVERTY
0.0/ 100
METRIC RATING
287th/ 347
METRIC RANK
10.1%
MALE POVERTY
97.9/ 100
METRIC RATING
60th/ 347
METRIC RANK
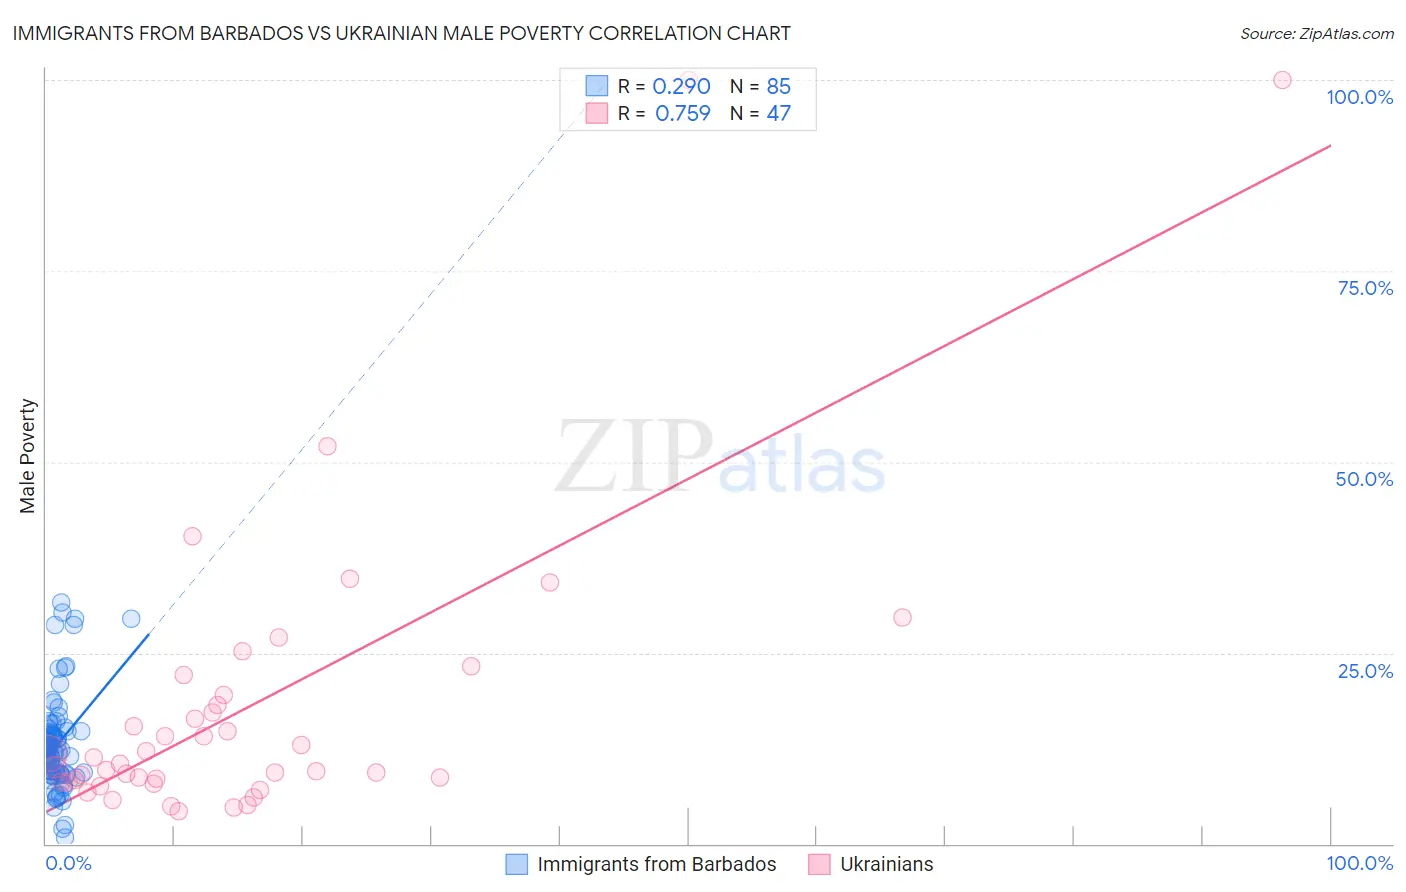
Immigrants from Barbados vs Ukrainian Male Poverty Correlation Chart
The statistical analysis conducted on geographies consisting of 112,769,360 people shows a weak positive correlation between the proportion of Immigrants from Barbados and poverty level among males in the United States with a correlation coefficient (R) of 0.290 and weighted average of 13.8%. Similarly, the statistical analysis conducted on geographies consisting of 447,972,433 people shows a strong positive correlation between the proportion of Ukrainians and poverty level among males in the United States with a correlation coefficient (R) of 0.759 and weighted average of 10.1%, a difference of 35.7%.
Male Poverty Correlation Summary
| Measurement | Immigrants from Barbados | Ukrainian |
| Minimum | 0.81% | 4.2% |
| Maximum | 31.7% | 100.0% |
| Range | 30.9% | 95.8% |
| Mean | 13.0% | 18.1% |
| Median | 12.0% | 10.5% |
| Interquartile 25% (IQ1) | 9.1% | 8.1% |
| Interquartile 75% (IQ3) | 14.7% | 19.5% |
| Interquartile Range (IQR) | 5.6% | 11.4% |
| Standard Deviation (Sample) | 6.3% | 20.2% |
| Standard Deviation (Population) | 6.2% | 20.0% |
Similar Demographics by Male Poverty
Demographics Similar to Immigrants from Barbados by Male Poverty
In terms of male poverty, the demographic groups most similar to Immigrants from Barbados are Shoshone (13.8%, a difference of 0.020%), West Indian (13.8%, a difference of 0.050%), Immigrants from Haiti (13.8%, a difference of 0.060%), Comanche (13.8%, a difference of 0.070%), and Immigrants from St. Vincent and the Grenadines (13.8%, a difference of 0.17%).
| Demographics | Rating | Rank | Male Poverty |
| Mexicans | 0.0 /100 | #280 | Tragic 13.7% |
| Yaqui | 0.0 /100 | #281 | Tragic 13.7% |
| Immigrants | Cabo Verde | 0.0 /100 | #282 | Tragic 13.7% |
| Comanche | 0.0 /100 | #283 | Tragic 13.8% |
| Immigrants | Haiti | 0.0 /100 | #284 | Tragic 13.8% |
| West Indians | 0.0 /100 | #285 | Tragic 13.8% |
| Shoshone | 0.0 /100 | #286 | Tragic 13.8% |
| Immigrants | Barbados | 0.0 /100 | #287 | Tragic 13.8% |
| Immigrants | St. Vincent and the Grenadines | 0.0 /100 | #288 | Tragic 13.8% |
| Guatemalans | 0.0 /100 | #289 | Tragic 13.8% |
| Immigrants | Zaire | 0.0 /100 | #290 | Tragic 13.8% |
| Vietnamese | 0.0 /100 | #291 | Tragic 13.8% |
| Indonesians | 0.0 /100 | #292 | Tragic 13.8% |
| Immigrants | Belize | 0.0 /100 | #293 | Tragic 13.8% |
| Hispanics or Latinos | 0.0 /100 | #294 | Tragic 13.9% |
Demographics Similar to Ukrainians by Male Poverty
In terms of male poverty, the demographic groups most similar to Ukrainians are Austrian (10.1%, a difference of 0.020%), Immigrants from Europe (10.1%, a difference of 0.090%), Immigrants from Italy (10.2%, a difference of 0.11%), Slovak (10.2%, a difference of 0.15%), and Scandinavian (10.1%, a difference of 0.22%).
| Demographics | Rating | Rank | Male Poverty |
| Immigrants | Czechoslovakia | 98.6 /100 | #53 | Exceptional 10.0% |
| Immigrants | Austria | 98.5 /100 | #54 | Exceptional 10.0% |
| Germans | 98.3 /100 | #55 | Exceptional 10.1% |
| Immigrants | Bulgaria | 98.2 /100 | #56 | Exceptional 10.1% |
| Estonians | 98.1 /100 | #57 | Exceptional 10.1% |
| Scandinavians | 98.0 /100 | #58 | Exceptional 10.1% |
| Immigrants | Europe | 97.9 /100 | #59 | Exceptional 10.1% |
| Ukrainians | 97.9 /100 | #60 | Exceptional 10.1% |
| Austrians | 97.8 /100 | #61 | Exceptional 10.1% |
| Immigrants | Italy | 97.8 /100 | #62 | Exceptional 10.2% |
| Slovaks | 97.7 /100 | #63 | Exceptional 10.2% |
| Swiss | 97.5 /100 | #64 | Exceptional 10.2% |
| Zimbabweans | 97.5 /100 | #65 | Exceptional 10.2% |
| Serbians | 97.5 /100 | #66 | Exceptional 10.2% |
| Immigrants | Netherlands | 97.3 /100 | #67 | Exceptional 10.2% |