Yakama vs Tsimshian Child Poverty Under the Age of 5
COMPARE
Yakama
Tsimshian
Child Poverty Under the Age of 5
Child Poverty Under the Age of 5 Comparison
Yakama
Tsimshian
23.1%
CHILD POVERTY UNDER THE AGE OF 5
0.0/ 100
METRIC RATING
316th/ 347
METRIC RANK
14.7%
CHILD POVERTY UNDER THE AGE OF 5
99.6/ 100
METRIC RATING
46th/ 347
METRIC RANK
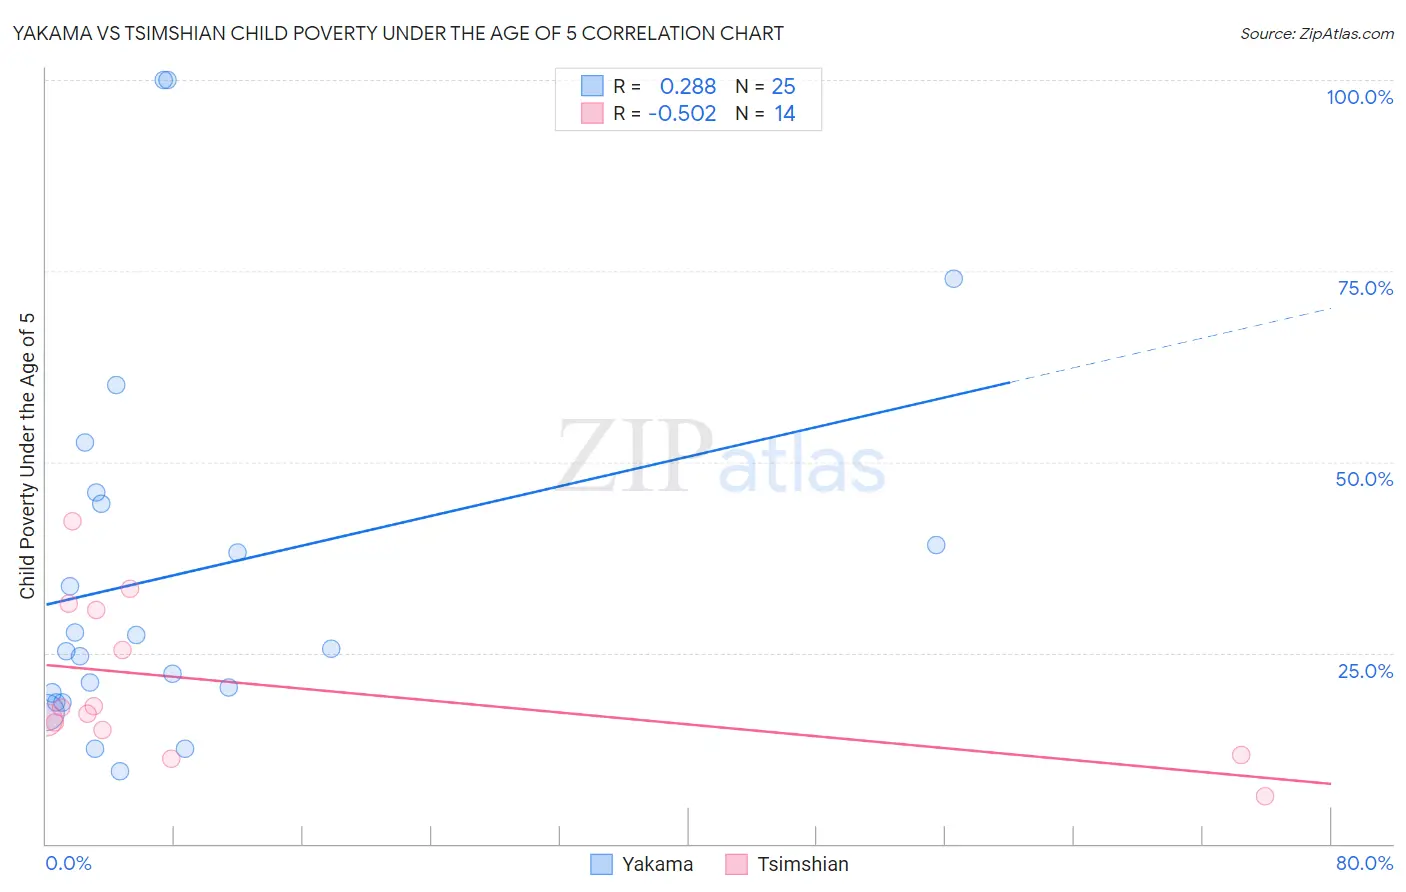
Yakama vs Tsimshian Child Poverty Under the Age of 5 Correlation Chart
The statistical analysis conducted on geographies consisting of 19,733,416 people shows a weak positive correlation between the proportion of Yakama and poverty level among children under the age of 5 in the United States with a correlation coefficient (R) of 0.288 and weighted average of 23.1%. Similarly, the statistical analysis conducted on geographies consisting of 15,568,381 people shows a substantial negative correlation between the proportion of Tsimshian and poverty level among children under the age of 5 in the United States with a correlation coefficient (R) of -0.502 and weighted average of 14.7%, a difference of 57.1%.
Child Poverty Under the Age of 5 Correlation Summary
| Measurement | Yakama | Tsimshian |
| Minimum | 9.4% | 6.2% |
| Maximum | 100.0% | 42.3% |
| Range | 90.6% | 36.2% |
| Mean | 35.6% | 20.8% |
| Median | 25.6% | 17.4% |
| Interquartile 25% (IQ1) | 19.1% | 14.9% |
| Interquartile 75% (IQ3) | 45.3% | 30.6% |
| Interquartile Range (IQR) | 26.1% | 15.6% |
| Standard Deviation (Sample) | 24.9% | 10.2% |
| Standard Deviation (Population) | 24.4% | 9.8% |
Similar Demographics by Child Poverty Under the Age of 5
Demographics Similar to Yakama by Child Poverty Under the Age of 5
In terms of child poverty under the age of 5, the demographic groups most similar to Yakama are Arapaho (23.1%, a difference of 0.12%), Menominee (23.3%, a difference of 0.50%), Dutch West Indian (23.3%, a difference of 0.60%), U.S. Virgin Islander (23.0%, a difference of 0.68%), and Bahamian (23.0%, a difference of 0.76%).
| Demographics | Rating | Rank | Child Poverty Under the Age of 5 |
| Houma | 0.0 /100 | #309 | Tragic 22.7% |
| Africans | 0.0 /100 | #310 | Tragic 22.8% |
| Seminole | 0.0 /100 | #311 | Tragic 22.8% |
| Hondurans | 0.0 /100 | #312 | Tragic 23.0% |
| Bahamians | 0.0 /100 | #313 | Tragic 23.0% |
| U.S. Virgin Islanders | 0.0 /100 | #314 | Tragic 23.0% |
| Arapaho | 0.0 /100 | #315 | Tragic 23.1% |
| Yakama | 0.0 /100 | #316 | Tragic 23.1% |
| Menominee | 0.0 /100 | #317 | Tragic 23.3% |
| Dutch West Indians | 0.0 /100 | #318 | Tragic 23.3% |
| Chippewa | 0.0 /100 | #319 | Tragic 23.4% |
| Choctaw | 0.0 /100 | #320 | Tragic 23.5% |
| Immigrants | Honduras | 0.0 /100 | #321 | Tragic 23.5% |
| Ute | 0.0 /100 | #322 | Tragic 23.5% |
| Pueblo | 0.0 /100 | #323 | Tragic 23.7% |
Demographics Similar to Tsimshian by Child Poverty Under the Age of 5
In terms of child poverty under the age of 5, the demographic groups most similar to Tsimshian are Laotian (14.7%, a difference of 0.080%), Russian (14.8%, a difference of 0.14%), Immigrants from Philippines (14.7%, a difference of 0.20%), Immigrants from Czechoslovakia (14.8%, a difference of 0.24%), and Soviet Union (14.7%, a difference of 0.34%).
| Demographics | Rating | Rank | Child Poverty Under the Age of 5 |
| Norwegians | 99.7 /100 | #39 | Exceptional 14.6% |
| Immigrants | Australia | 99.7 /100 | #40 | Exceptional 14.6% |
| Immigrants | Belarus | 99.7 /100 | #41 | Exceptional 14.7% |
| Soviet Union | 99.7 /100 | #42 | Exceptional 14.7% |
| Immigrants | Greece | 99.7 /100 | #43 | Exceptional 14.7% |
| Immigrants | Philippines | 99.7 /100 | #44 | Exceptional 14.7% |
| Laotians | 99.6 /100 | #45 | Exceptional 14.7% |
| Tsimshian | 99.6 /100 | #46 | Exceptional 14.7% |
| Russians | 99.6 /100 | #47 | Exceptional 14.8% |
| Immigrants | Czechoslovakia | 99.6 /100 | #48 | Exceptional 14.8% |
| Immigrants | Bulgaria | 99.6 /100 | #49 | Exceptional 14.8% |
| Immigrants | Northern Europe | 99.6 /100 | #50 | Exceptional 14.8% |
| Estonians | 99.6 /100 | #51 | Exceptional 14.8% |
| Immigrants | Serbia | 99.5 /100 | #52 | Exceptional 14.9% |
| Luxembourgers | 99.4 /100 | #53 | Exceptional 14.9% |