Immigrants from North America vs Marshallese Single Male Poverty
COMPARE
Immigrants from North America
Marshallese
Single Male Poverty
Single Male Poverty Comparison
Immigrants from North America
Marshallese
12.9%
SINGLE MALE POVERTY
37.7/ 100
METRIC RATING
180th/ 347
METRIC RANK
16.4%
SINGLE MALE POVERTY
0.0/ 100
METRIC RATING
320th/ 347
METRIC RANK
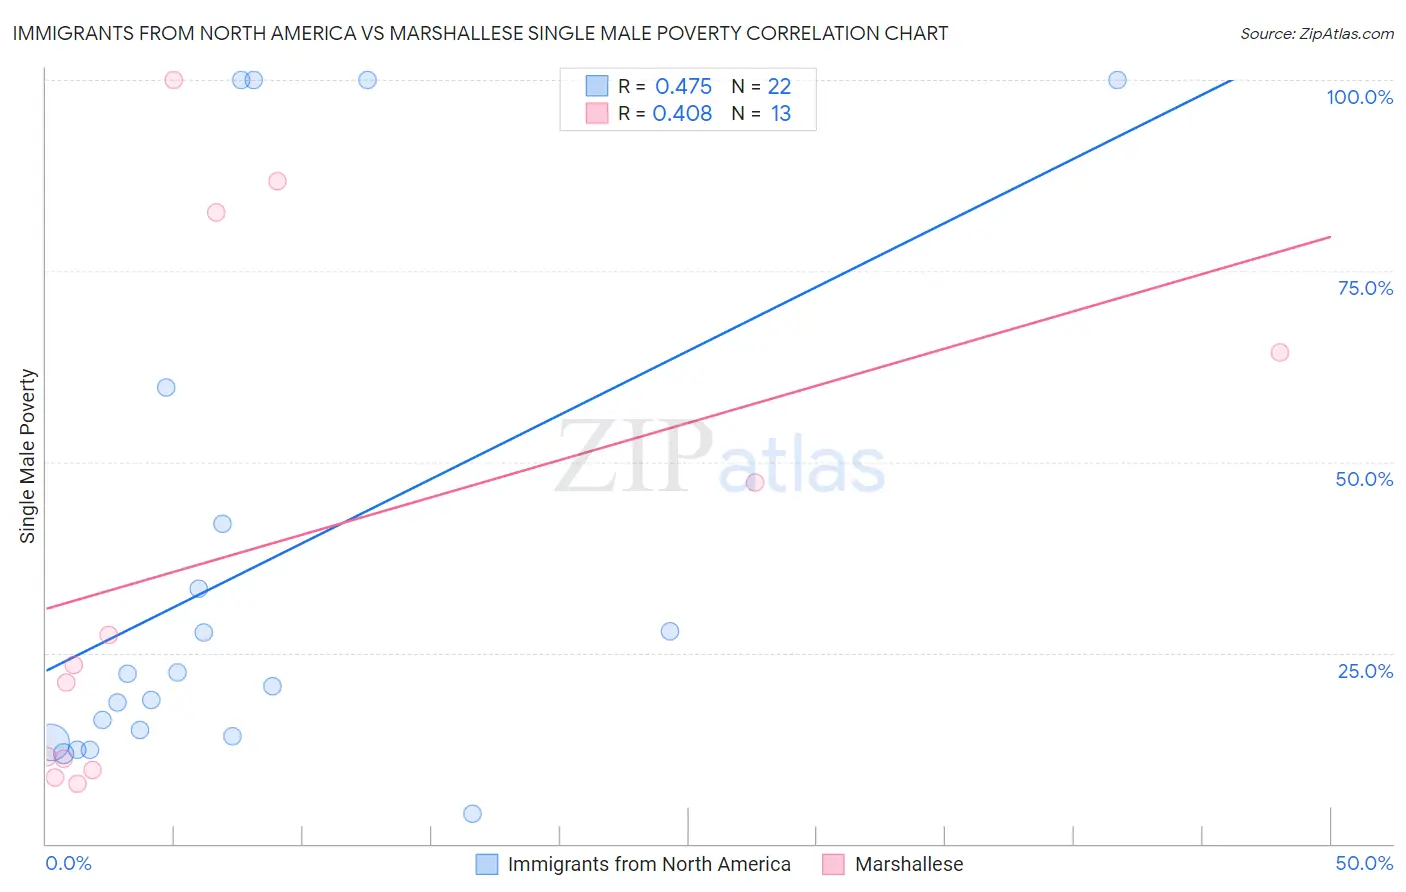
Immigrants from North America vs Marshallese Single Male Poverty Correlation Chart
The statistical analysis conducted on geographies consisting of 398,248,842 people shows a moderate positive correlation between the proportion of Immigrants from North America and poverty level among single males in the United States with a correlation coefficient (R) of 0.475 and weighted average of 12.9%. Similarly, the statistical analysis conducted on geographies consisting of 14,469,521 people shows a moderate positive correlation between the proportion of Marshallese and poverty level among single males in the United States with a correlation coefficient (R) of 0.408 and weighted average of 16.4%, a difference of 27.7%.
Single Male Poverty Correlation Summary
| Measurement | Immigrants from North America | Marshallese |
| Minimum | 4.0% | 7.9% |
| Maximum | 100.0% | 100.0% |
| Range | 96.0% | 92.1% |
| Mean | 36.0% | 38.6% |
| Median | 21.5% | 23.3% |
| Interquartile 25% (IQ1) | 14.1% | 10.4% |
| Interquartile 75% (IQ3) | 41.9% | 73.5% |
| Interquartile Range (IQR) | 27.8% | 63.1% |
| Standard Deviation (Sample) | 33.0% | 33.7% |
| Standard Deviation (Population) | 32.3% | 32.3% |
Similar Demographics by Single Male Poverty
Demographics Similar to Immigrants from North America by Single Male Poverty
In terms of single male poverty, the demographic groups most similar to Immigrants from North America are Panamanian (12.9%, a difference of 0.010%), Moroccan (12.9%, a difference of 0.050%), Israeli (12.9%, a difference of 0.18%), Immigrants from West Indies (12.9%, a difference of 0.27%), and Immigrants from Switzerland (12.8%, a difference of 0.29%).
| Demographics | Rating | Rank | Single Male Poverty |
| Immigrants | St. Vincent and the Grenadines | 50.9 /100 | #173 | Average 12.8% |
| Costa Ricans | 50.0 /100 | #174 | Average 12.8% |
| Croatians | 48.9 /100 | #175 | Average 12.8% |
| Syrians | 48.4 /100 | #176 | Average 12.8% |
| Immigrants | Canada | 44.8 /100 | #177 | Average 12.8% |
| Immigrants | Switzerland | 43.1 /100 | #178 | Average 12.8% |
| Israelis | 41.0 /100 | #179 | Average 12.9% |
| Immigrants | North America | 37.7 /100 | #180 | Fair 12.9% |
| Panamanians | 37.6 /100 | #181 | Fair 12.9% |
| Moroccans | 36.8 /100 | #182 | Fair 12.9% |
| Immigrants | West Indies | 33.0 /100 | #183 | Fair 12.9% |
| Immigrants | Trinidad and Tobago | 32.5 /100 | #184 | Fair 12.9% |
| Norwegians | 32.0 /100 | #185 | Fair 12.9% |
| Nigerians | 31.9 /100 | #186 | Fair 12.9% |
| Immigrants | Kuwait | 31.9 /100 | #187 | Fair 12.9% |
Demographics Similar to Marshallese by Single Male Poverty
In terms of single male poverty, the demographic groups most similar to Marshallese are Osage (16.5%, a difference of 0.13%), Chippewa (16.4%, a difference of 0.48%), Chickasaw (16.3%, a difference of 0.78%), Shoshone (16.7%, a difference of 1.4%), and Black/African American (16.2%, a difference of 1.6%).
| Demographics | Rating | Rank | Single Male Poverty |
| Cherokee | 0.0 /100 | #313 | Tragic 16.1% |
| Alaskan Athabascans | 0.0 /100 | #314 | Tragic 16.1% |
| Cheyenne | 0.0 /100 | #315 | Tragic 16.1% |
| Dutch West Indians | 0.0 /100 | #316 | Tragic 16.1% |
| Blacks/African Americans | 0.0 /100 | #317 | Tragic 16.2% |
| Chickasaw | 0.0 /100 | #318 | Tragic 16.3% |
| Chippewa | 0.0 /100 | #319 | Tragic 16.4% |
| Marshallese | 0.0 /100 | #320 | Tragic 16.4% |
| Osage | 0.0 /100 | #321 | Tragic 16.5% |
| Shoshone | 0.0 /100 | #322 | Tragic 16.7% |
| Creek | 0.0 /100 | #323 | Tragic 16.8% |
| Immigrants | Yemen | 0.0 /100 | #324 | Tragic 16.9% |
| Choctaw | 0.0 /100 | #325 | Tragic 17.0% |
| Central American Indians | 0.0 /100 | #326 | Tragic 17.2% |
| Menominee | 0.0 /100 | #327 | Tragic 17.7% |