Immigrants from North America vs Alaska Native Single Male Poverty
COMPARE
Immigrants from North America
Alaska Native
Single Male Poverty
Single Male Poverty Comparison
Immigrants from North America
Alaska Natives
12.9%
SINGLE MALE POVERTY
37.7/ 100
METRIC RATING
180th/ 347
METRIC RANK
15.4%
SINGLE MALE POVERTY
0.0/ 100
METRIC RATING
304th/ 347
METRIC RANK
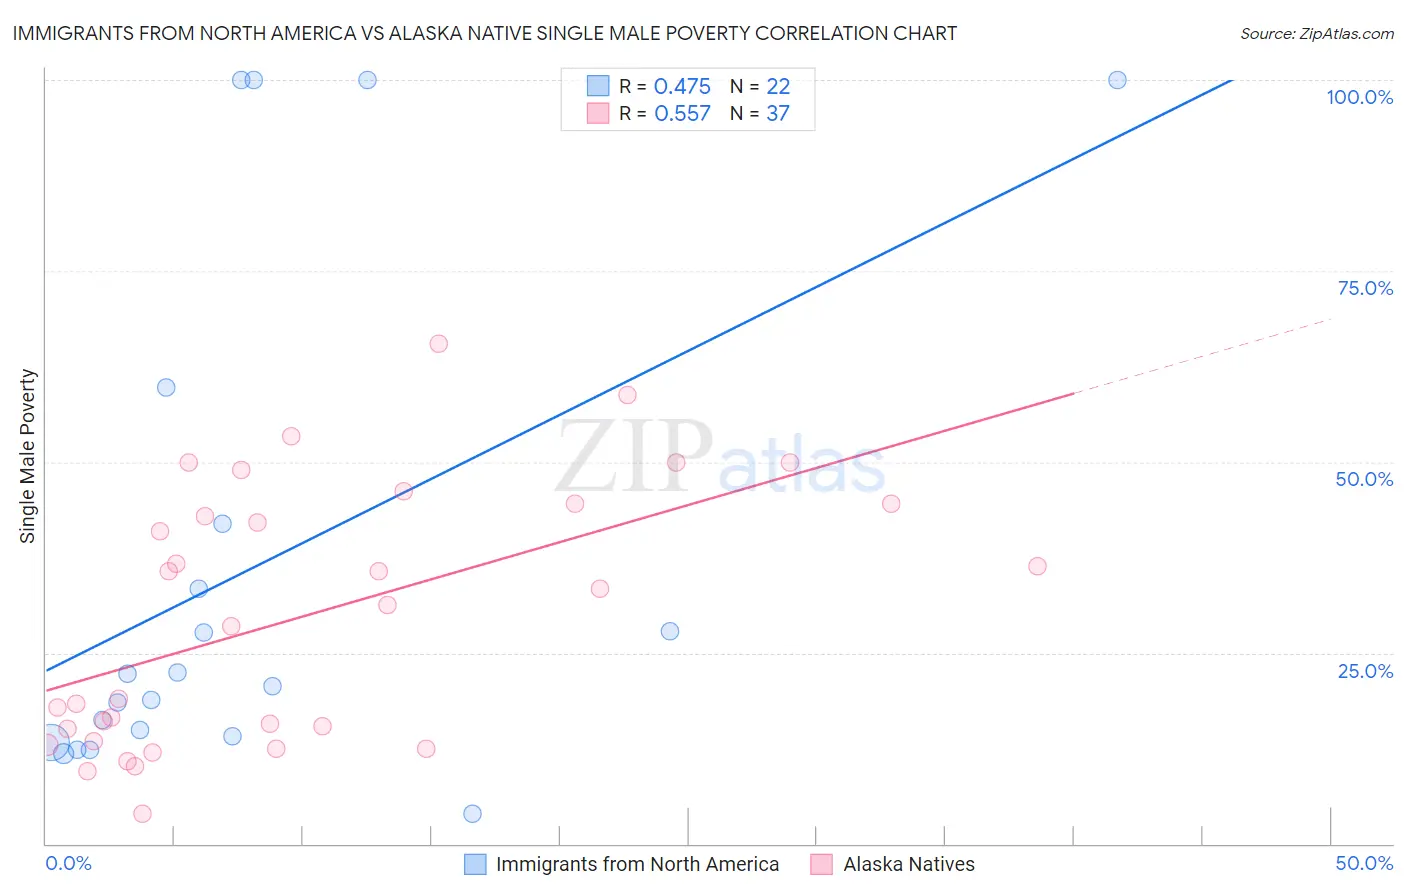
Immigrants from North America vs Alaska Native Single Male Poverty Correlation Chart
The statistical analysis conducted on geographies consisting of 398,248,842 people shows a moderate positive correlation between the proportion of Immigrants from North America and poverty level among single males in the United States with a correlation coefficient (R) of 0.475 and weighted average of 12.9%. Similarly, the statistical analysis conducted on geographies consisting of 74,357,121 people shows a substantial positive correlation between the proportion of Alaska Natives and poverty level among single males in the United States with a correlation coefficient (R) of 0.557 and weighted average of 15.4%, a difference of 19.7%.
Single Male Poverty Correlation Summary
| Measurement | Immigrants from North America | Alaska Native |
| Minimum | 4.0% | 4.0% |
| Maximum | 100.0% | 65.5% |
| Range | 96.0% | 61.5% |
| Mean | 36.0% | 29.9% |
| Median | 21.5% | 31.2% |
| Interquartile 25% (IQ1) | 14.1% | 14.2% |
| Interquartile 75% (IQ3) | 41.9% | 44.4% |
| Interquartile Range (IQR) | 27.8% | 30.2% |
| Standard Deviation (Sample) | 33.0% | 16.9% |
| Standard Deviation (Population) | 32.3% | 16.6% |
Similar Demographics by Single Male Poverty
Demographics Similar to Immigrants from North America by Single Male Poverty
In terms of single male poverty, the demographic groups most similar to Immigrants from North America are Panamanian (12.9%, a difference of 0.010%), Moroccan (12.9%, a difference of 0.050%), Israeli (12.9%, a difference of 0.18%), Immigrants from West Indies (12.9%, a difference of 0.27%), and Immigrants from Switzerland (12.8%, a difference of 0.29%).
| Demographics | Rating | Rank | Single Male Poverty |
| Immigrants | St. Vincent and the Grenadines | 50.9 /100 | #173 | Average 12.8% |
| Costa Ricans | 50.0 /100 | #174 | Average 12.8% |
| Croatians | 48.9 /100 | #175 | Average 12.8% |
| Syrians | 48.4 /100 | #176 | Average 12.8% |
| Immigrants | Canada | 44.8 /100 | #177 | Average 12.8% |
| Immigrants | Switzerland | 43.1 /100 | #178 | Average 12.8% |
| Israelis | 41.0 /100 | #179 | Average 12.9% |
| Immigrants | North America | 37.7 /100 | #180 | Fair 12.9% |
| Panamanians | 37.6 /100 | #181 | Fair 12.9% |
| Moroccans | 36.8 /100 | #182 | Fair 12.9% |
| Immigrants | West Indies | 33.0 /100 | #183 | Fair 12.9% |
| Immigrants | Trinidad and Tobago | 32.5 /100 | #184 | Fair 12.9% |
| Norwegians | 32.0 /100 | #185 | Fair 12.9% |
| Nigerians | 31.9 /100 | #186 | Fair 12.9% |
| Immigrants | Kuwait | 31.9 /100 | #187 | Fair 12.9% |
Demographics Similar to Alaska Natives by Single Male Poverty
In terms of single male poverty, the demographic groups most similar to Alaska Natives are Aleut (15.4%, a difference of 0.11%), Blackfeet (15.5%, a difference of 0.53%), Pennsylvania German (15.6%, a difference of 0.96%), Alsatian (15.2%, a difference of 1.1%), and Dominican (15.2%, a difference of 1.3%).
| Demographics | Rating | Rank | Single Male Poverty |
| Immigrants | Dominican Republic | 0.0 /100 | #297 | Tragic 14.8% |
| French American Indians | 0.0 /100 | #298 | Tragic 15.0% |
| Delaware | 0.0 /100 | #299 | Tragic 15.0% |
| Cree | 0.0 /100 | #300 | Tragic 15.1% |
| Dominicans | 0.0 /100 | #301 | Tragic 15.2% |
| Alsatians | 0.0 /100 | #302 | Tragic 15.2% |
| Aleuts | 0.0 /100 | #303 | Tragic 15.4% |
| Alaska Natives | 0.0 /100 | #304 | Tragic 15.4% |
| Blackfeet | 0.0 /100 | #305 | Tragic 15.5% |
| Pennsylvania Germans | 0.0 /100 | #306 | Tragic 15.6% |
| Ute | 0.0 /100 | #307 | Tragic 15.7% |
| Potawatomi | 0.0 /100 | #308 | Tragic 15.8% |
| Americans | 0.0 /100 | #309 | Tragic 15.8% |
| Yakama | 0.0 /100 | #310 | Tragic 15.9% |
| Seminole | 0.0 /100 | #311 | Tragic 16.0% |