Immigrants from North America vs Immigrants from Indonesia Male Poverty
COMPARE
Immigrants from North America
Immigrants from Indonesia
Male Poverty
Male Poverty Comparison
Immigrants from North America
Immigrants from Indonesia
10.3%
MALE POVERTY
96.5/ 100
METRIC RATING
79th/ 347
METRIC RANK
10.5%
MALE POVERTY
93.3/ 100
METRIC RATING
99th/ 347
METRIC RANK
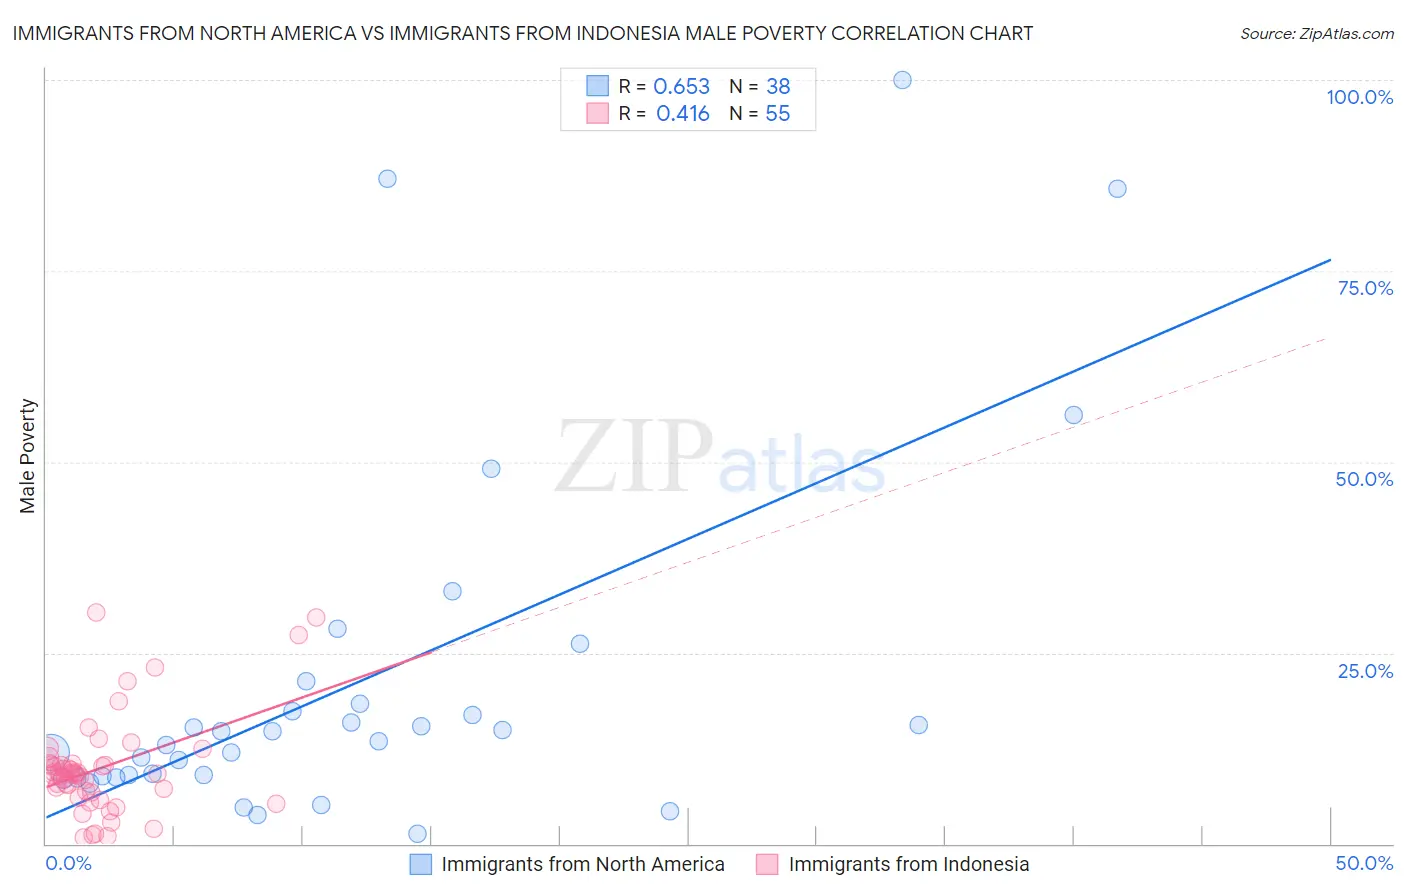
Immigrants from North America vs Immigrants from Indonesia Male Poverty Correlation Chart
The statistical analysis conducted on geographies consisting of 461,883,462 people shows a significant positive correlation between the proportion of Immigrants from North America and poverty level among males in the United States with a correlation coefficient (R) of 0.653 and weighted average of 10.3%. Similarly, the statistical analysis conducted on geographies consisting of 215,697,022 people shows a moderate positive correlation between the proportion of Immigrants from Indonesia and poverty level among males in the United States with a correlation coefficient (R) of 0.416 and weighted average of 10.5%, a difference of 1.8%.
Male Poverty Correlation Summary
| Measurement | Immigrants from North America | Immigrants from Indonesia |
| Minimum | 1.3% | 0.89% |
| Maximum | 100.0% | 30.3% |
| Range | 98.8% | 29.4% |
| Mean | 21.2% | 9.9% |
| Median | 14.1% | 9.2% |
| Interquartile 25% (IQ1) | 8.9% | 6.8% |
| Interquartile 75% (IQ3) | 18.3% | 10.5% |
| Interquartile Range (IQR) | 9.5% | 3.7% |
| Standard Deviation (Sample) | 23.5% | 6.4% |
| Standard Deviation (Population) | 23.2% | 6.3% |
Demographics Similar to Immigrants from North America and Immigrants from Indonesia by Male Poverty
In terms of male poverty, the demographic groups most similar to Immigrants from North America are English (10.3%, a difference of 0.080%), Belgian (10.3%, a difference of 0.47%), Egyptian (10.3%, a difference of 0.48%), Immigrants from Sweden (10.3%, a difference of 0.60%), and Czechoslovakian (10.3%, a difference of 0.67%). Similarly, the demographic groups most similar to Immigrants from Indonesia are Finnish (10.5%, a difference of 0.060%), Romanian (10.5%, a difference of 0.13%), Immigrants from Egypt (10.4%, a difference of 0.18%), Scottish (10.4%, a difference of 0.31%), and Immigrants from South Africa (10.4%, a difference of 0.34%).
| Demographics | Rating | Rank | Male Poverty |
| Immigrants | North America | 96.5 /100 | #79 | Exceptional 10.3% |
| English | 96.4 /100 | #80 | Exceptional 10.3% |
| Belgians | 95.9 /100 | #81 | Exceptional 10.3% |
| Egyptians | 95.9 /100 | #82 | Exceptional 10.3% |
| Immigrants | Sweden | 95.7 /100 | #83 | Exceptional 10.3% |
| Czechoslovakians | 95.6 /100 | #84 | Exceptional 10.3% |
| Immigrants | England | 95.5 /100 | #85 | Exceptional 10.4% |
| Immigrants | Eastern Asia | 95.3 /100 | #86 | Exceptional 10.4% |
| Northern Europeans | 95.2 /100 | #87 | Exceptional 10.4% |
| Cambodians | 95.0 /100 | #88 | Exceptional 10.4% |
| Immigrants | Denmark | 95.0 /100 | #89 | Exceptional 10.4% |
| Indians (Asian) | 94.9 /100 | #90 | Exceptional 10.4% |
| British | 94.8 /100 | #91 | Exceptional 10.4% |
| Jordanians | 94.4 /100 | #92 | Exceptional 10.4% |
| Australians | 94.4 /100 | #93 | Exceptional 10.4% |
| Immigrants | South Africa | 94.1 /100 | #94 | Exceptional 10.4% |
| Scottish | 94.0 /100 | #95 | Exceptional 10.4% |
| Immigrants | Egypt | 93.7 /100 | #96 | Exceptional 10.4% |
| Romanians | 93.6 /100 | #97 | Exceptional 10.5% |
| Finns | 93.4 /100 | #98 | Exceptional 10.5% |
| Immigrants | Indonesia | 93.3 /100 | #99 | Exceptional 10.5% |