Immigrants from Afghanistan vs French Male Poverty
COMPARE
Immigrants from Afghanistan
French
Male Poverty
Male Poverty Comparison
Immigrants from Afghanistan
French
11.4%
MALE POVERTY
33.3/ 100
METRIC RATING
185th/ 347
METRIC RANK
10.7%
MALE POVERTY
86.7/ 100
METRIC RATING
124th/ 347
METRIC RANK
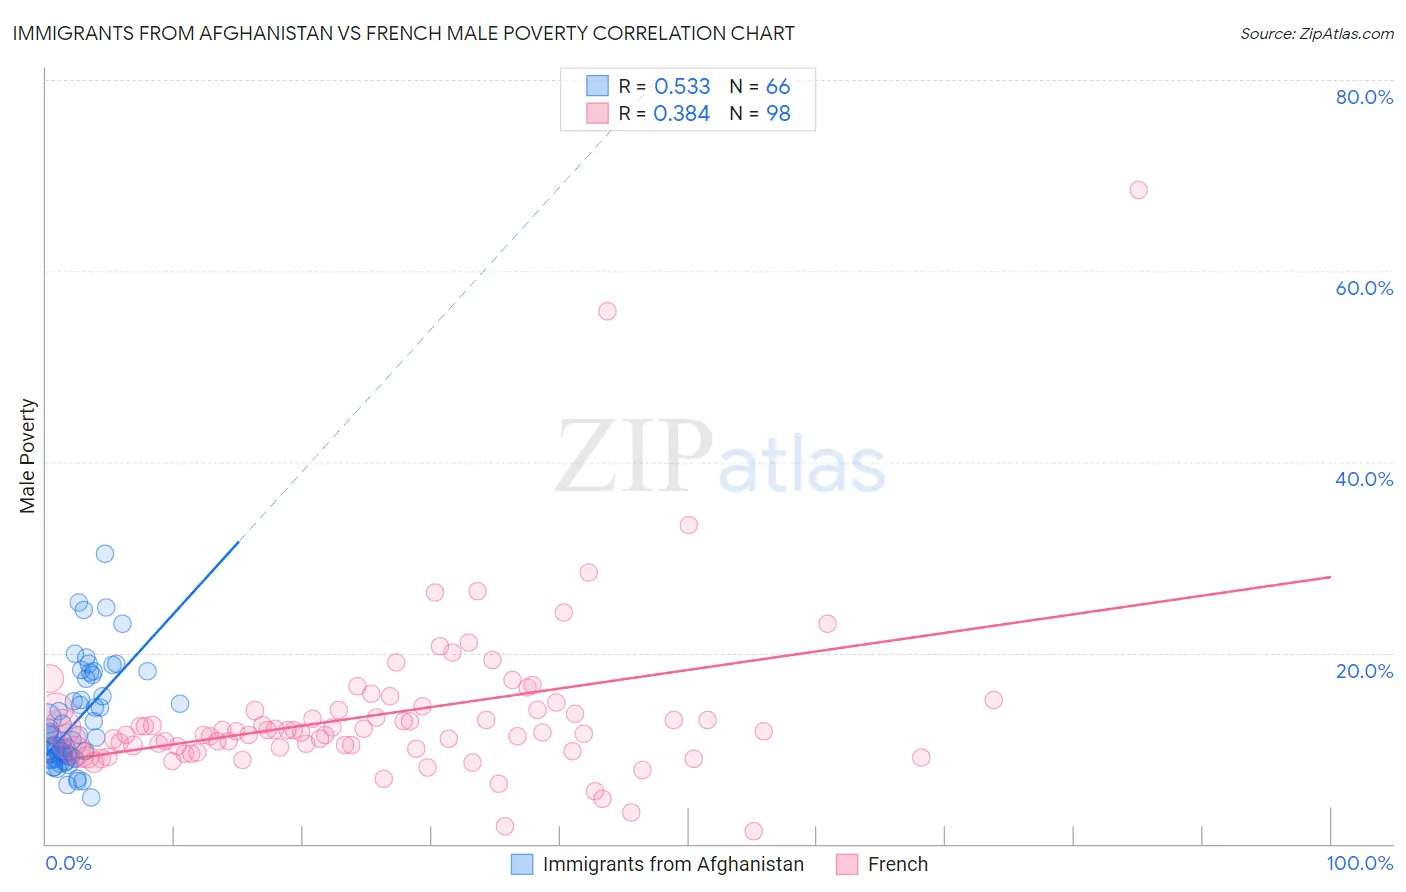
Immigrants from Afghanistan vs French Male Poverty Correlation Chart
The statistical analysis conducted on geographies consisting of 147,624,521 people shows a substantial positive correlation between the proportion of Immigrants from Afghanistan and poverty level among males in the United States with a correlation coefficient (R) of 0.533 and weighted average of 11.4%. Similarly, the statistical analysis conducted on geographies consisting of 570,714,674 people shows a mild positive correlation between the proportion of French and poverty level among males in the United States with a correlation coefficient (R) of 0.384 and weighted average of 10.7%, a difference of 6.6%.
Male Poverty Correlation Summary
| Measurement | Immigrants from Afghanistan | French |
| Minimum | 4.9% | 1.3% |
| Maximum | 30.4% | 68.4% |
| Range | 25.5% | 67.2% |
| Mean | 12.8% | 13.6% |
| Median | 11.0% | 11.7% |
| Interquartile 25% (IQ1) | 9.1% | 9.9% |
| Interquartile 75% (IQ3) | 15.5% | 14.0% |
| Interquartile Range (IQR) | 6.4% | 4.1% |
| Standard Deviation (Sample) | 5.3% | 8.8% |
| Standard Deviation (Population) | 5.3% | 8.7% |
Similar Demographics by Male Poverty
Demographics Similar to Immigrants from Afghanistan by Male Poverty
In terms of male poverty, the demographic groups most similar to Immigrants from Afghanistan are Immigrants from Sierra Leone (11.4%, a difference of 0.050%), Immigrants from Iraq (11.4%, a difference of 0.16%), Immigrants from South America (11.3%, a difference of 0.38%), Sierra Leonean (11.4%, a difference of 0.38%), and Kenyan (11.3%, a difference of 0.54%).
| Demographics | Rating | Rank | Male Poverty |
| Immigrants | Cameroon | 44.5 /100 | #178 | Average 11.2% |
| Immigrants | Syria | 40.3 /100 | #179 | Average 11.3% |
| Immigrants | Morocco | 40.1 /100 | #180 | Average 11.3% |
| Immigrants | Costa Rica | 39.5 /100 | #181 | Fair 11.3% |
| Mongolians | 39.0 /100 | #182 | Fair 11.3% |
| Kenyans | 38.4 /100 | #183 | Fair 11.3% |
| Immigrants | South America | 36.9 /100 | #184 | Fair 11.3% |
| Immigrants | Afghanistan | 33.3 /100 | #185 | Fair 11.4% |
| Immigrants | Sierra Leone | 32.9 /100 | #186 | Fair 11.4% |
| Immigrants | Iraq | 31.9 /100 | #187 | Fair 11.4% |
| Sierra Leoneans | 29.9 /100 | #188 | Fair 11.4% |
| Hawaiians | 28.3 /100 | #189 | Fair 11.4% |
| Israelis | 26.1 /100 | #190 | Fair 11.5% |
| South American Indians | 22.8 /100 | #191 | Fair 11.5% |
| Immigrants | Uruguay | 19.1 /100 | #192 | Poor 11.6% |
Demographics Similar to French by Male Poverty
In terms of male poverty, the demographic groups most similar to French are South African (10.7%, a difference of 0.030%), Native Hawaiian (10.7%, a difference of 0.070%), Peruvian (10.7%, a difference of 0.080%), Immigrants from China (10.7%, a difference of 0.10%), and Immigrants from Norway (10.7%, a difference of 0.15%).
| Demographics | Rating | Rank | Male Poverty |
| Immigrants | South Eastern Asia | 88.1 /100 | #117 | Excellent 10.6% |
| Okinawans | 87.6 /100 | #118 | Excellent 10.7% |
| Immigrants | Hungary | 87.6 /100 | #119 | Excellent 10.7% |
| Immigrants | China | 87.1 /100 | #120 | Excellent 10.7% |
| Peruvians | 87.1 /100 | #121 | Excellent 10.7% |
| Native Hawaiians | 87.0 /100 | #122 | Excellent 10.7% |
| South Africans | 86.8 /100 | #123 | Excellent 10.7% |
| French | 86.7 /100 | #124 | Excellent 10.7% |
| Immigrants | Norway | 86.0 /100 | #125 | Excellent 10.7% |
| Immigrants | Ukraine | 84.3 /100 | #126 | Excellent 10.7% |
| Puget Sound Salish | 84.3 /100 | #127 | Excellent 10.7% |
| Immigrants | Western Europe | 84.2 /100 | #128 | Excellent 10.7% |
| Immigrants | Peru | 84.1 /100 | #129 | Excellent 10.7% |
| Chileans | 83.9 /100 | #130 | Excellent 10.7% |
| Immigrants | Belarus | 83.3 /100 | #131 | Excellent 10.7% |