Immigrants from Nicaragua vs Norwegian Child Poverty Under the Age of 5
COMPARE
Immigrants from Nicaragua
Norwegian
Child Poverty Under the Age of 5
Child Poverty Under the Age of 5 Comparison
Immigrants from Nicaragua
Norwegians
19.8%
CHILD POVERTY UNDER THE AGE OF 5
0.3/ 100
METRIC RATING
252nd/ 347
METRIC RANK
14.6%
CHILD POVERTY UNDER THE AGE OF 5
99.7/ 100
METRIC RATING
39th/ 347
METRIC RANK
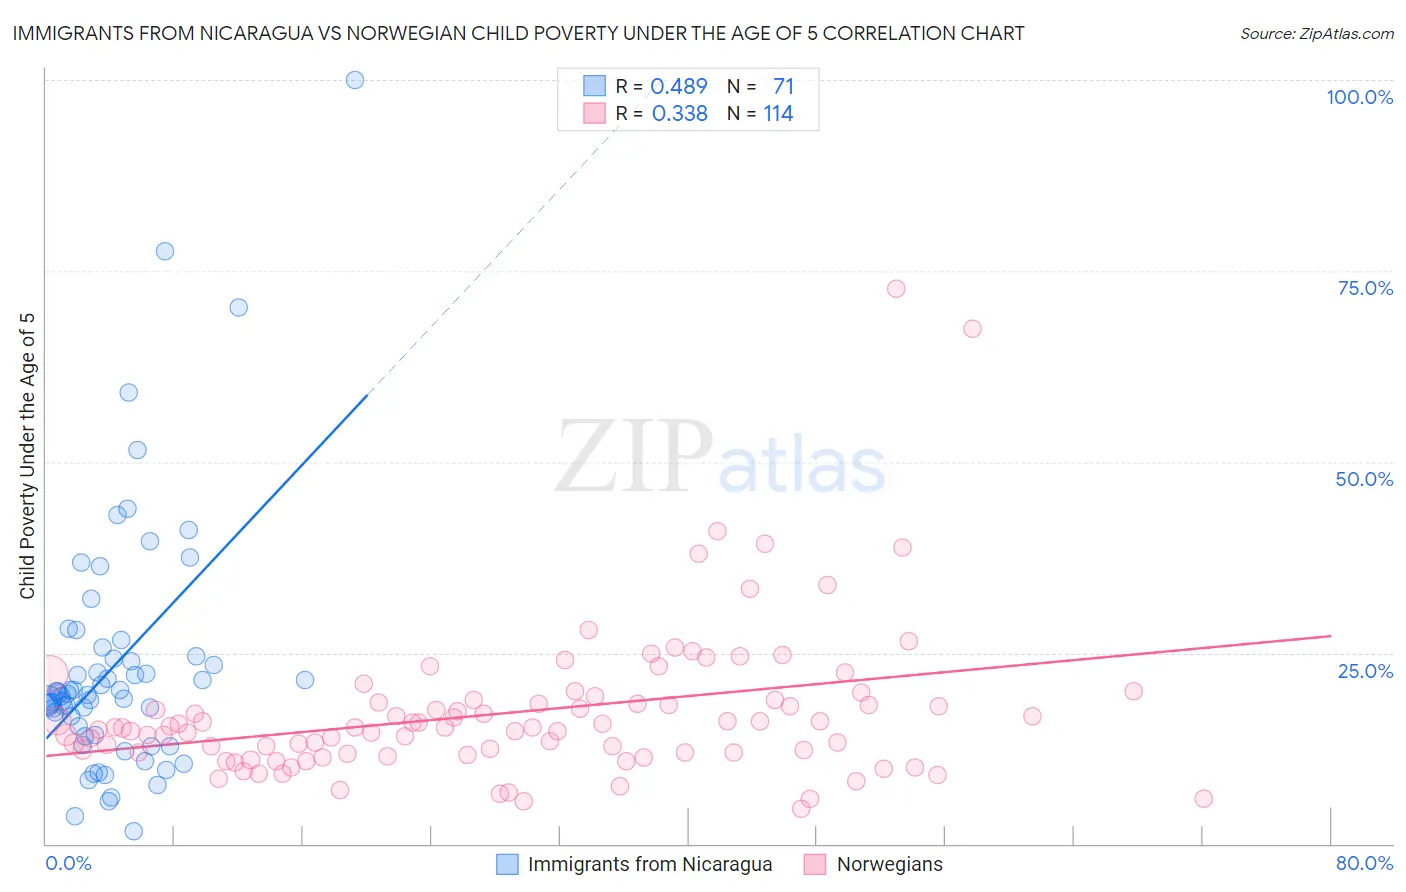
Immigrants from Nicaragua vs Norwegian Child Poverty Under the Age of 5 Correlation Chart
The statistical analysis conducted on geographies consisting of 232,258,486 people shows a moderate positive correlation between the proportion of Immigrants from Nicaragua and poverty level among children under the age of 5 in the United States with a correlation coefficient (R) of 0.489 and weighted average of 19.8%. Similarly, the statistical analysis conducted on geographies consisting of 498,503,242 people shows a mild positive correlation between the proportion of Norwegians and poverty level among children under the age of 5 in the United States with a correlation coefficient (R) of 0.338 and weighted average of 14.6%, a difference of 35.5%.
Child Poverty Under the Age of 5 Correlation Summary
| Measurement | Immigrants from Nicaragua | Norwegian |
| Minimum | 1.7% | 4.5% |
| Maximum | 100.0% | 72.7% |
| Range | 98.3% | 68.2% |
| Mean | 23.5% | 17.2% |
| Median | 19.7% | 15.2% |
| Interquartile 25% (IQ1) | 14.3% | 11.9% |
| Interquartile 75% (IQ3) | 24.5% | 18.5% |
| Interquartile Range (IQR) | 10.2% | 6.6% |
| Standard Deviation (Sample) | 16.7% | 10.0% |
| Standard Deviation (Population) | 16.5% | 10.0% |
Similar Demographics by Child Poverty Under the Age of 5
Demographics Similar to Immigrants from Nicaragua by Child Poverty Under the Age of 5
In terms of child poverty under the age of 5, the demographic groups most similar to Immigrants from Nicaragua are Pennsylvania German (19.8%, a difference of 0.040%), Nonimmigrants (19.7%, a difference of 0.22%), Immigrants from Middle Africa (19.7%, a difference of 0.27%), Marshallese (19.7%, a difference of 0.29%), and Guyanese (19.7%, a difference of 0.30%).
| Demographics | Rating | Rank | Child Poverty Under the Age of 5 |
| Immigrants | Western Africa | 0.4 /100 | #245 | Tragic 19.7% |
| Cree | 0.4 /100 | #246 | Tragic 19.7% |
| Guyanese | 0.4 /100 | #247 | Tragic 19.7% |
| Marshallese | 0.4 /100 | #248 | Tragic 19.7% |
| Immigrants | Middle Africa | 0.4 /100 | #249 | Tragic 19.7% |
| Immigrants | Nonimmigrants | 0.4 /100 | #250 | Tragic 19.7% |
| Pennsylvania Germans | 0.3 /100 | #251 | Tragic 19.8% |
| Immigrants | Nicaragua | 0.3 /100 | #252 | Tragic 19.8% |
| Mexican American Indians | 0.3 /100 | #253 | Tragic 19.9% |
| Fijians | 0.3 /100 | #254 | Tragic 19.9% |
| Immigrants | Cuba | 0.2 /100 | #255 | Tragic 19.9% |
| Immigrants | Barbados | 0.2 /100 | #256 | Tragic 20.0% |
| Shoshone | 0.2 /100 | #257 | Tragic 20.0% |
| Immigrants | St. Vincent and the Grenadines | 0.2 /100 | #258 | Tragic 20.0% |
| Immigrants | El Salvador | 0.2 /100 | #259 | Tragic 20.0% |
Demographics Similar to Norwegians by Child Poverty Under the Age of 5
In terms of child poverty under the age of 5, the demographic groups most similar to Norwegians are Eastern European (14.6%, a difference of 0.0%), Turkish (14.6%, a difference of 0.27%), Immigrants from Australia (14.6%, a difference of 0.29%), Immigrants from Belarus (14.7%, a difference of 0.41%), and Soviet Union (14.7%, a difference of 0.57%).
| Demographics | Rating | Rank | Child Poverty Under the Age of 5 |
| Immigrants | Sri Lanka | 99.8 /100 | #32 | Exceptional 14.4% |
| Taiwanese | 99.8 /100 | #33 | Exceptional 14.5% |
| Immigrants | Moldova | 99.8 /100 | #34 | Exceptional 14.5% |
| Latvians | 99.8 /100 | #35 | Exceptional 14.5% |
| Maltese | 99.8 /100 | #36 | Exceptional 14.5% |
| Turks | 99.7 /100 | #37 | Exceptional 14.6% |
| Eastern Europeans | 99.7 /100 | #38 | Exceptional 14.6% |
| Norwegians | 99.7 /100 | #39 | Exceptional 14.6% |
| Immigrants | Australia | 99.7 /100 | #40 | Exceptional 14.6% |
| Immigrants | Belarus | 99.7 /100 | #41 | Exceptional 14.7% |
| Soviet Union | 99.7 /100 | #42 | Exceptional 14.7% |
| Immigrants | Greece | 99.7 /100 | #43 | Exceptional 14.7% |
| Immigrants | Philippines | 99.7 /100 | #44 | Exceptional 14.7% |
| Laotians | 99.6 /100 | #45 | Exceptional 14.7% |
| Tsimshian | 99.6 /100 | #46 | Exceptional 14.7% |