Immigrants from Nicaragua vs Arab College, 1 year or more
COMPARE
Immigrants from Nicaragua
Arab
College, 1 year or more
College, 1 year or more Comparison
Immigrants from Nicaragua
Arabs
52.4%
COLLEGE, 1 YEAR OR MORE
0.0/ 100
METRIC RATING
299th/ 347
METRIC RANK
61.6%
COLLEGE, 1 YEAR OR MORE
93.9/ 100
METRIC RATING
117th/ 347
METRIC RANK
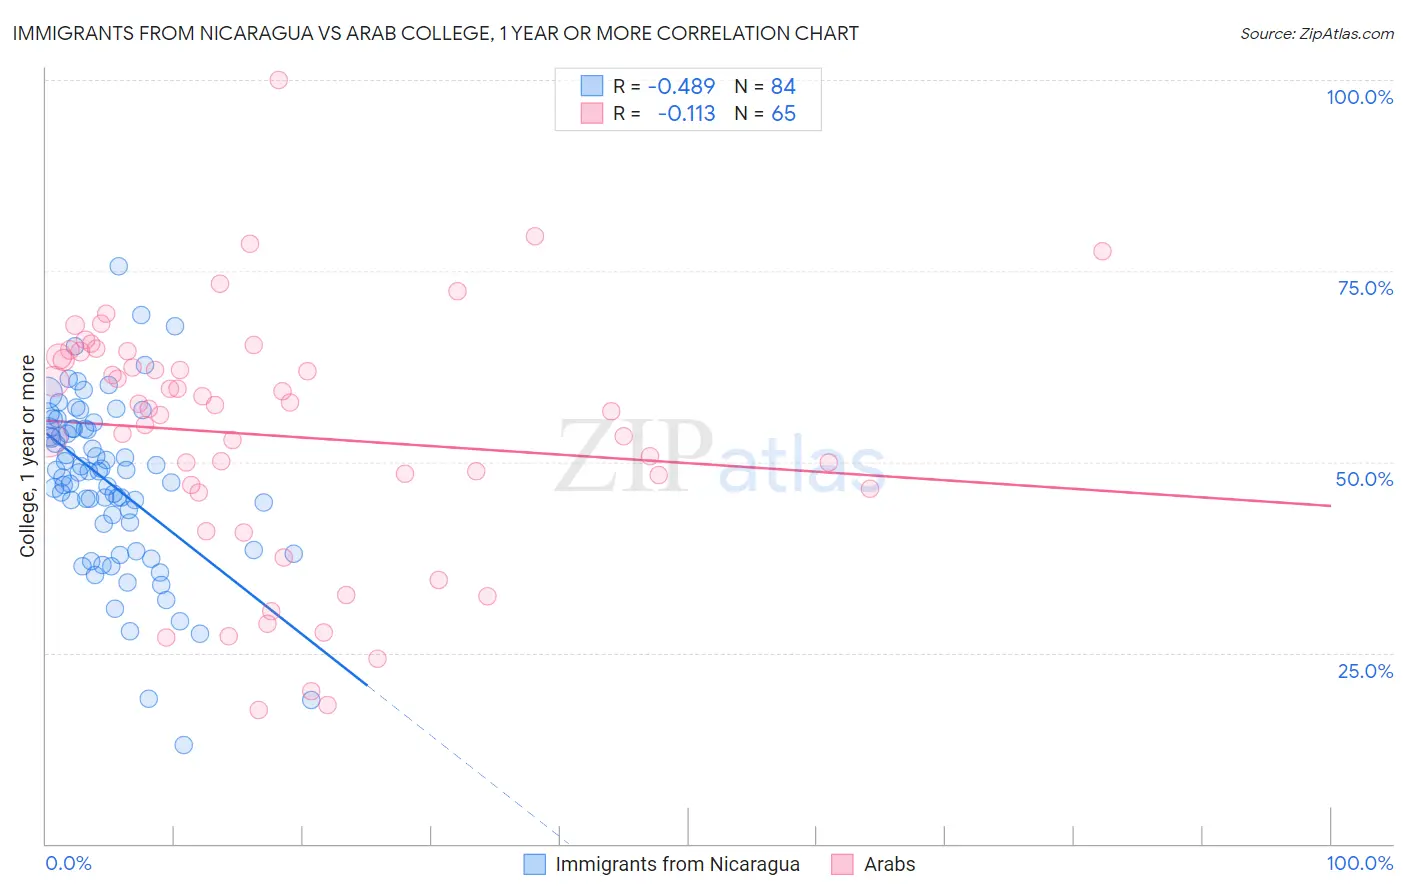
Immigrants from Nicaragua vs Arab College, 1 year or more Correlation Chart
The statistical analysis conducted on geographies consisting of 236,341,850 people shows a moderate negative correlation between the proportion of Immigrants from Nicaragua and percentage of population with at least college, 1 year or more education in the United States with a correlation coefficient (R) of -0.489 and weighted average of 52.4%. Similarly, the statistical analysis conducted on geographies consisting of 486,868,588 people shows a poor negative correlation between the proportion of Arabs and percentage of population with at least college, 1 year or more education in the United States with a correlation coefficient (R) of -0.113 and weighted average of 61.6%, a difference of 17.6%.
College, 1 year or more Correlation Summary
| Measurement | Immigrants from Nicaragua | Arab |
| Minimum | 13.0% | 17.6% |
| Maximum | 75.6% | 100.0% |
| Range | 62.6% | 82.4% |
| Mean | 47.2% | 53.4% |
| Median | 48.6% | 57.0% |
| Interquartile 25% (IQ1) | 40.2% | 46.2% |
| Interquartile 75% (IQ3) | 54.4% | 64.1% |
| Interquartile Range (IQR) | 14.2% | 17.9% |
| Standard Deviation (Sample) | 11.2% | 16.3% |
| Standard Deviation (Population) | 11.1% | 16.2% |
Similar Demographics by College, 1 year or more
Demographics Similar to Immigrants from Nicaragua by College, 1 year or more
In terms of college, 1 year or more, the demographic groups most similar to Immigrants from Nicaragua are Choctaw (52.3%, a difference of 0.040%), Haitian (52.3%, a difference of 0.10%), Puerto Rican (52.2%, a difference of 0.23%), Creek (52.2%, a difference of 0.30%), and Immigrants from Dominica (52.5%, a difference of 0.34%).
| Demographics | Rating | Rank | College, 1 year or more |
| Chickasaw | 0.0 /100 | #292 | Tragic 53.3% |
| Blacks/African Americans | 0.0 /100 | #293 | Tragic 53.3% |
| Cherokee | 0.0 /100 | #294 | Tragic 53.2% |
| Yaqui | 0.0 /100 | #295 | Tragic 53.2% |
| Sioux | 0.0 /100 | #296 | Tragic 53.0% |
| Paiute | 0.0 /100 | #297 | Tragic 52.9% |
| Immigrants | Dominica | 0.0 /100 | #298 | Tragic 52.5% |
| Immigrants | Nicaragua | 0.0 /100 | #299 | Tragic 52.4% |
| Choctaw | 0.0 /100 | #300 | Tragic 52.3% |
| Haitians | 0.0 /100 | #301 | Tragic 52.3% |
| Puerto Ricans | 0.0 /100 | #302 | Tragic 52.2% |
| Creek | 0.0 /100 | #303 | Tragic 52.2% |
| Central Americans | 0.0 /100 | #304 | Tragic 52.1% |
| Seminole | 0.0 /100 | #305 | Tragic 52.1% |
| Mexican American Indians | 0.0 /100 | #306 | Tragic 51.9% |
Demographics Similar to Arabs by College, 1 year or more
In terms of college, 1 year or more, the demographic groups most similar to Arabs are Immigrants from Brazil (61.6%, a difference of 0.0%), Lebanese (61.6%, a difference of 0.040%), Norwegian (61.7%, a difference of 0.14%), Assyrian/Chaldean/Syriac (61.5%, a difference of 0.14%), and Pakistani (61.5%, a difference of 0.14%).
| Demographics | Rating | Rank | College, 1 year or more |
| Europeans | 95.6 /100 | #110 | Exceptional 61.8% |
| Macedonians | 95.6 /100 | #111 | Exceptional 61.8% |
| Austrians | 95.4 /100 | #112 | Exceptional 61.8% |
| Ukrainians | 95.2 /100 | #113 | Exceptional 61.8% |
| Danes | 94.8 /100 | #114 | Exceptional 61.7% |
| Norwegians | 94.5 /100 | #115 | Exceptional 61.7% |
| Lebanese | 94.1 /100 | #116 | Exceptional 61.6% |
| Arabs | 93.9 /100 | #117 | Exceptional 61.6% |
| Immigrants | Brazil | 93.9 /100 | #118 | Exceptional 61.6% |
| Assyrians/Chaldeans/Syriacs | 93.3 /100 | #119 | Exceptional 61.5% |
| Pakistanis | 93.2 /100 | #120 | Exceptional 61.5% |
| Immigrants | Jordan | 92.7 /100 | #121 | Exceptional 61.4% |
| Immigrants | Chile | 92.3 /100 | #122 | Exceptional 61.4% |
| Serbians | 92.2 /100 | #123 | Exceptional 61.4% |
| Venezuelans | 92.1 /100 | #124 | Exceptional 61.3% |