Immigrants from Nepal vs West Indian Female Poverty Among 25-34 Year Olds
COMPARE
Immigrants from Nepal
West Indian
Female Poverty Among 25-34 Year Olds
Female Poverty Among 25-34 Year Olds Comparison
Immigrants from Nepal
West Indians
12.8%
FEMALE POVERTY AMONG 25-34 YEAR OLDS
93.0/ 100
METRIC RATING
119th/ 347
METRIC RANK
15.2%
FEMALE POVERTY AMONG 25-34 YEAR OLDS
0.3/ 100
METRIC RATING
256th/ 347
METRIC RANK
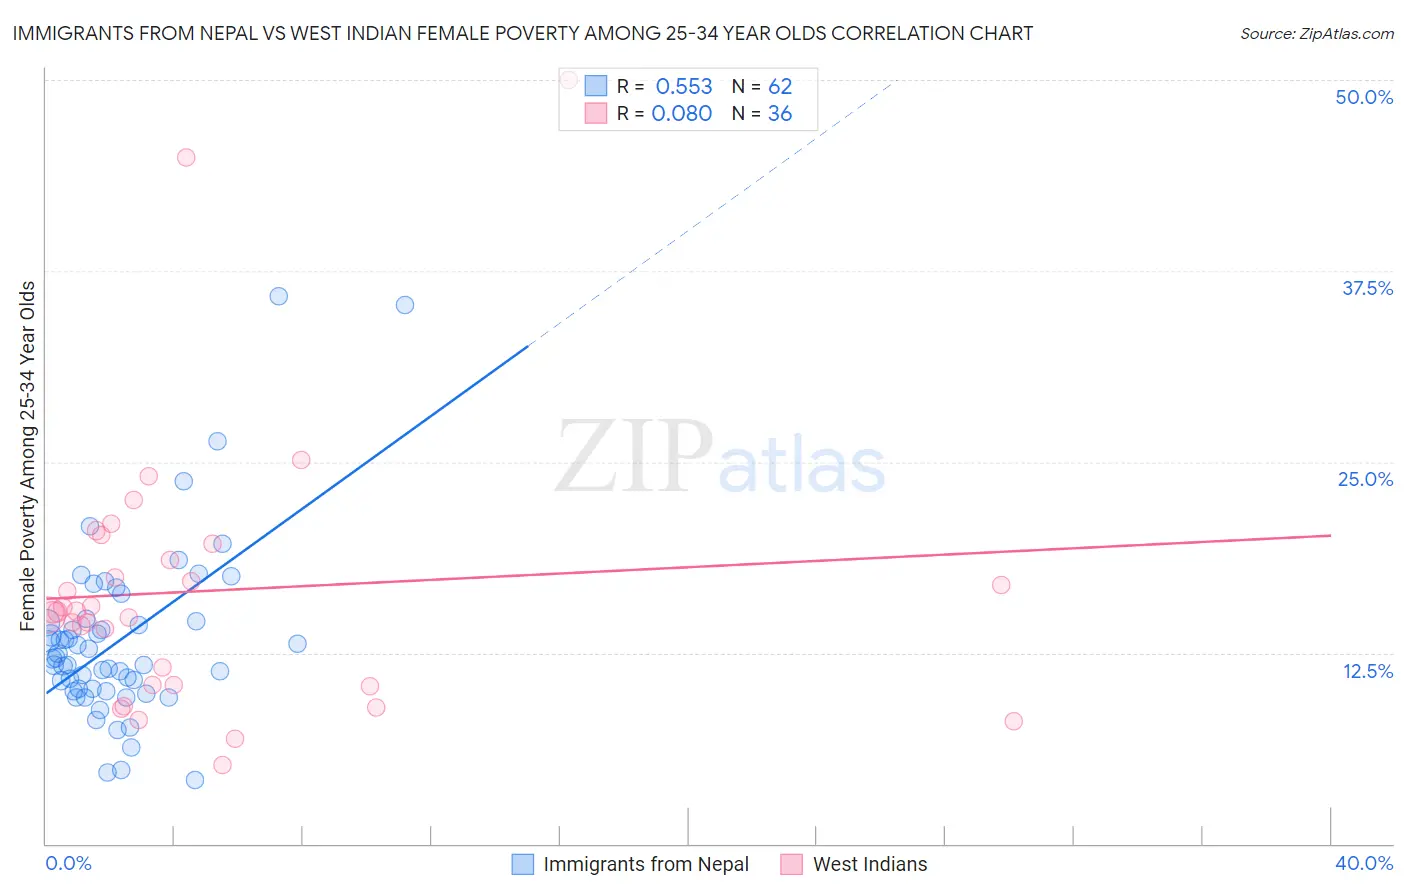
Immigrants from Nepal vs West Indian Female Poverty Among 25-34 Year Olds Correlation Chart
The statistical analysis conducted on geographies consisting of 185,514,428 people shows a substantial positive correlation between the proportion of Immigrants from Nepal and poverty level among females between the ages 25 and 34 in the United States with a correlation coefficient (R) of 0.553 and weighted average of 12.8%. Similarly, the statistical analysis conducted on geographies consisting of 252,060,649 people shows a slight positive correlation between the proportion of West Indians and poverty level among females between the ages 25 and 34 in the United States with a correlation coefficient (R) of 0.080 and weighted average of 15.2%, a difference of 18.5%.
Female Poverty Among 25-34 Year Olds Correlation Summary
| Measurement | Immigrants from Nepal | West Indian |
| Minimum | 4.2% | 5.1% |
| Maximum | 35.9% | 50.0% |
| Range | 31.7% | 44.9% |
| Mean | 13.4% | 16.5% |
| Median | 12.1% | 15.2% |
| Interquartile 25% (IQ1) | 10.1% | 10.4% |
| Interquartile 75% (IQ3) | 14.5% | 19.1% |
| Interquartile Range (IQR) | 4.4% | 8.7% |
| Standard Deviation (Sample) | 5.8% | 9.0% |
| Standard Deviation (Population) | 5.8% | 8.9% |
Similar Demographics by Female Poverty Among 25-34 Year Olds
Demographics Similar to Immigrants from Nepal by Female Poverty Among 25-34 Year Olds
In terms of female poverty among 25-34 year olds, the demographic groups most similar to Immigrants from Nepal are Carpatho Rusyn (12.8%, a difference of 0.0%), Mongolian (12.8%, a difference of 0.010%), Immigrants from Kuwait (12.8%, a difference of 0.020%), Romanian (12.8%, a difference of 0.070%), and Chilean (12.8%, a difference of 0.080%).
| Demographics | Rating | Rank | Female Poverty Among 25-34 Year Olds |
| Immigrants | Morocco | 93.9 /100 | #112 | Exceptional 12.8% |
| Immigrants | Syria | 93.8 /100 | #113 | Exceptional 12.8% |
| Immigrants | Southern Europe | 93.6 /100 | #114 | Exceptional 12.8% |
| Immigrants | Brazil | 93.3 /100 | #115 | Exceptional 12.8% |
| Chileans | 93.2 /100 | #116 | Exceptional 12.8% |
| Immigrants | Kuwait | 93.1 /100 | #117 | Exceptional 12.8% |
| Mongolians | 93.0 /100 | #118 | Exceptional 12.8% |
| Immigrants | Nepal | 93.0 /100 | #119 | Exceptional 12.8% |
| Carpatho Rusyns | 93.0 /100 | #120 | Exceptional 12.8% |
| Romanians | 92.8 /100 | #121 | Exceptional 12.8% |
| Immigrants | Western Asia | 92.7 /100 | #122 | Exceptional 12.8% |
| Slovenes | 92.7 /100 | #123 | Exceptional 12.8% |
| Immigrants | Netherlands | 92.0 /100 | #124 | Exceptional 12.8% |
| Immigrants | Canada | 91.5 /100 | #125 | Exceptional 12.9% |
| Immigrants | Fiji | 91.2 /100 | #126 | Exceptional 12.9% |
Demographics Similar to West Indians by Female Poverty Among 25-34 Year Olds
In terms of female poverty among 25-34 year olds, the demographic groups most similar to West Indians are Immigrants from Burma/Myanmar (15.2%, a difference of 0.020%), Immigrants from Laos (15.2%, a difference of 0.17%), Nepalese (15.2%, a difference of 0.28%), Immigrants from Cuba (15.2%, a difference of 0.30%), and Somali (15.1%, a difference of 0.55%).
| Demographics | Rating | Rank | Female Poverty Among 25-34 Year Olds |
| Immigrants | Haiti | 0.5 /100 | #249 | Tragic 15.0% |
| Immigrants | El Salvador | 0.5 /100 | #250 | Tragic 15.0% |
| Haitians | 0.5 /100 | #251 | Tragic 15.0% |
| Belizeans | 0.4 /100 | #252 | Tragic 15.1% |
| Immigrants | West Indies | 0.4 /100 | #253 | Tragic 15.1% |
| Somalis | 0.4 /100 | #254 | Tragic 15.1% |
| Immigrants | Laos | 0.3 /100 | #255 | Tragic 15.2% |
| West Indians | 0.3 /100 | #256 | Tragic 15.2% |
| Immigrants | Burma/Myanmar | 0.3 /100 | #257 | Tragic 15.2% |
| Nepalese | 0.2 /100 | #258 | Tragic 15.2% |
| Immigrants | Cuba | 0.2 /100 | #259 | Tragic 15.2% |
| Marshallese | 0.2 /100 | #260 | Tragic 15.3% |
| Liberians | 0.2 /100 | #261 | Tragic 15.3% |
| Immigrants | Belize | 0.2 /100 | #262 | Tragic 15.3% |
| Mexican American Indians | 0.2 /100 | #263 | Tragic 15.4% |