Immigrants from Nepal vs West Indian Seniors Poverty Over the Age of 75
COMPARE
Immigrants from Nepal
West Indian
Seniors Poverty Over the Age of 75
Seniors Poverty Over the Age of 75 Comparison
Immigrants from Nepal
West Indians
11.8%
SENIORS POVERTY OVER THE AGE OF 75
84.5/ 100
METRIC RATING
120th/ 347
METRIC RANK
15.7%
SENIORS POVERTY OVER THE AGE OF 75
0.0/ 100
METRIC RATING
302nd/ 347
METRIC RANK
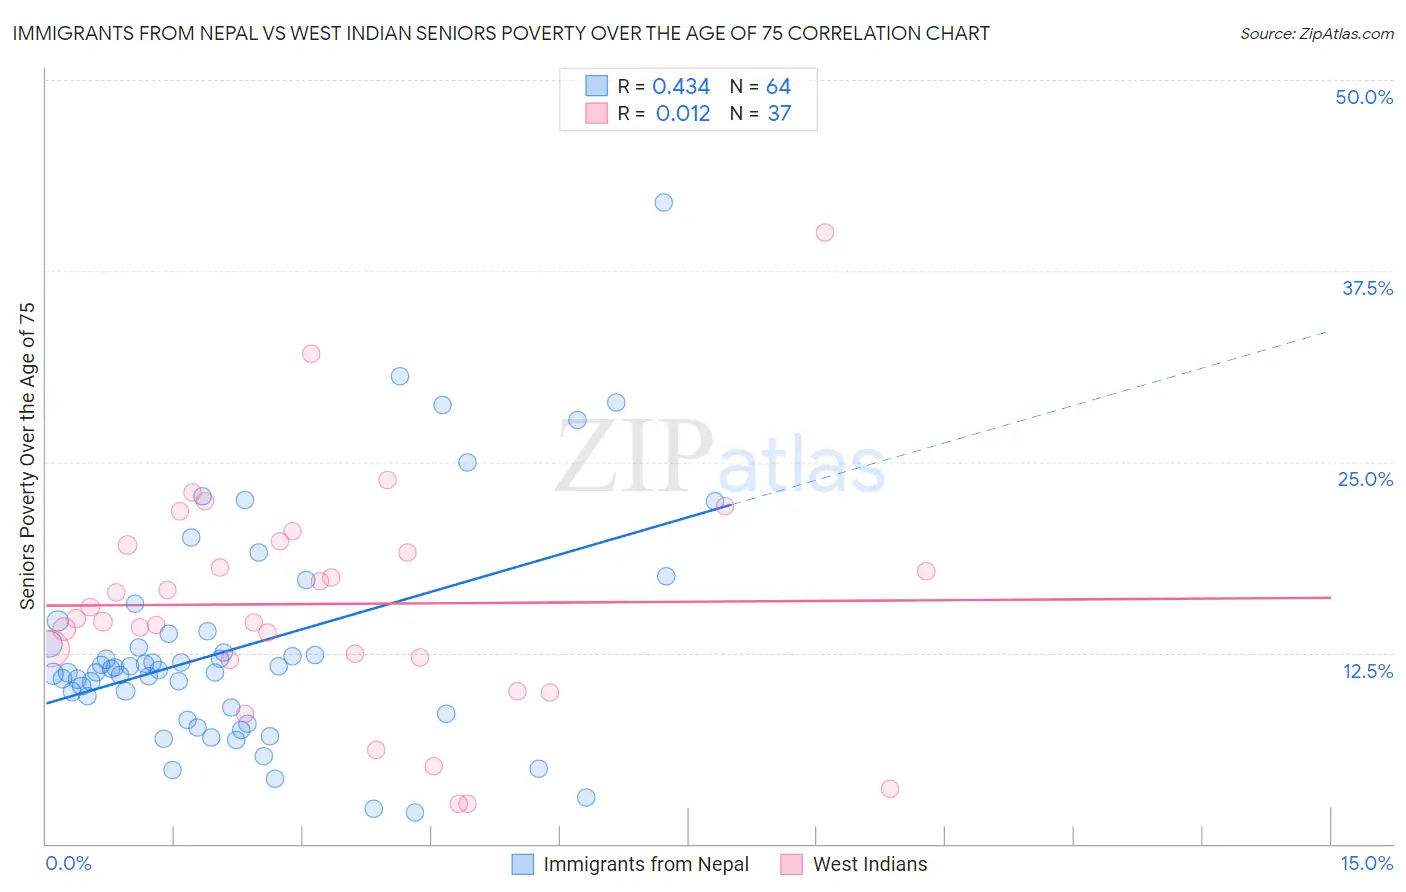
Immigrants from Nepal vs West Indian Seniors Poverty Over the Age of 75 Correlation Chart
The statistical analysis conducted on geographies consisting of 185,282,037 people shows a moderate positive correlation between the proportion of Immigrants from Nepal and poverty level among seniors over the age of 75 in the United States with a correlation coefficient (R) of 0.434 and weighted average of 11.8%. Similarly, the statistical analysis conducted on geographies consisting of 252,374,220 people shows no correlation between the proportion of West Indians and poverty level among seniors over the age of 75 in the United States with a correlation coefficient (R) of 0.012 and weighted average of 15.7%, a difference of 33.3%.
Seniors Poverty Over the Age of 75 Correlation Summary
| Measurement | Immigrants from Nepal | West Indian |
| Minimum | 2.1% | 2.6% |
| Maximum | 42.0% | 40.0% |
| Range | 39.9% | 37.4% |
| Mean | 12.9% | 15.7% |
| Median | 11.4% | 14.8% |
| Interquartile 25% (IQ1) | 8.7% | 12.1% |
| Interquartile 75% (IQ3) | 13.8% | 19.7% |
| Interquartile Range (IQR) | 5.1% | 7.6% |
| Standard Deviation (Sample) | 7.4% | 7.6% |
| Standard Deviation (Population) | 7.3% | 7.5% |
Similar Demographics by Seniors Poverty Over the Age of 75
Demographics Similar to Immigrants from Nepal by Seniors Poverty Over the Age of 75
In terms of seniors poverty over the age of 75, the demographic groups most similar to Immigrants from Nepal are Immigrants from Uganda (11.8%, a difference of 0.040%), Malaysian (11.8%, a difference of 0.080%), Pakistani (11.8%, a difference of 0.080%), Immigrants from Italy (11.8%, a difference of 0.090%), and Fijian (11.8%, a difference of 0.12%).
| Demographics | Rating | Rank | Seniors Poverty Over the Age of 75 |
| Immigrants | Czechoslovakia | 87.0 /100 | #113 | Excellent 11.7% |
| Ukrainians | 86.9 /100 | #114 | Excellent 11.7% |
| New Zealanders | 86.3 /100 | #115 | Excellent 11.7% |
| Iraqis | 86.3 /100 | #116 | Excellent 11.7% |
| Icelanders | 85.7 /100 | #117 | Excellent 11.7% |
| Immigrants | Zimbabwe | 85.5 /100 | #118 | Excellent 11.7% |
| Immigrants | Uganda | 84.8 /100 | #119 | Excellent 11.8% |
| Immigrants | Nepal | 84.5 /100 | #120 | Excellent 11.8% |
| Malaysians | 84.1 /100 | #121 | Excellent 11.8% |
| Pakistanis | 84.0 /100 | #122 | Excellent 11.8% |
| Immigrants | Italy | 84.0 /100 | #123 | Excellent 11.8% |
| Fijians | 83.8 /100 | #124 | Excellent 11.8% |
| Sudanese | 83.6 /100 | #125 | Excellent 11.8% |
| Pennsylvania Germans | 83.4 /100 | #126 | Excellent 11.8% |
| Immigrants | Denmark | 82.6 /100 | #127 | Excellent 11.8% |
Demographics Similar to West Indians by Seniors Poverty Over the Age of 75
In terms of seniors poverty over the age of 75, the demographic groups most similar to West Indians are Immigrants from Honduras (15.7%, a difference of 0.17%), Immigrants from Latin America (15.6%, a difference of 0.31%), Immigrants from Trinidad and Tobago (15.7%, a difference of 0.35%), Ecuadorian (15.7%, a difference of 0.39%), and Hispanic or Latino (15.8%, a difference of 0.55%).
| Demographics | Rating | Rank | Seniors Poverty Over the Age of 75 |
| U.S. Virgin Islanders | 0.0 /100 | #295 | Tragic 15.4% |
| Yuman | 0.0 /100 | #296 | Tragic 15.4% |
| Hondurans | 0.0 /100 | #297 | Tragic 15.4% |
| Natives/Alaskans | 0.0 /100 | #298 | Tragic 15.5% |
| Spanish American Indians | 0.0 /100 | #299 | Tragic 15.5% |
| Bahamians | 0.0 /100 | #300 | Tragic 15.5% |
| Immigrants | Latin America | 0.0 /100 | #301 | Tragic 15.6% |
| West Indians | 0.0 /100 | #302 | Tragic 15.7% |
| Immigrants | Honduras | 0.0 /100 | #303 | Tragic 15.7% |
| Immigrants | Trinidad and Tobago | 0.0 /100 | #304 | Tragic 15.7% |
| Ecuadorians | 0.0 /100 | #305 | Tragic 15.7% |
| Hispanics or Latinos | 0.0 /100 | #306 | Tragic 15.8% |
| Immigrants | West Indies | 0.0 /100 | #307 | Tragic 15.8% |
| Immigrants | Bangladesh | 0.0 /100 | #308 | Tragic 15.8% |
| Yup'ik | 0.0 /100 | #309 | Tragic 15.8% |