Immigrants from Yemen vs West Indian Female Poverty Among 25-34 Year Olds
COMPARE
Immigrants from Yemen
West Indian
Female Poverty Among 25-34 Year Olds
Female Poverty Among 25-34 Year Olds Comparison
Immigrants from Yemen
West Indians
19.8%
FEMALE POVERTY AMONG 25-34 YEAR OLDS
0.0/ 100
METRIC RATING
332nd/ 347
METRIC RANK
15.2%
FEMALE POVERTY AMONG 25-34 YEAR OLDS
0.3/ 100
METRIC RATING
256th/ 347
METRIC RANK
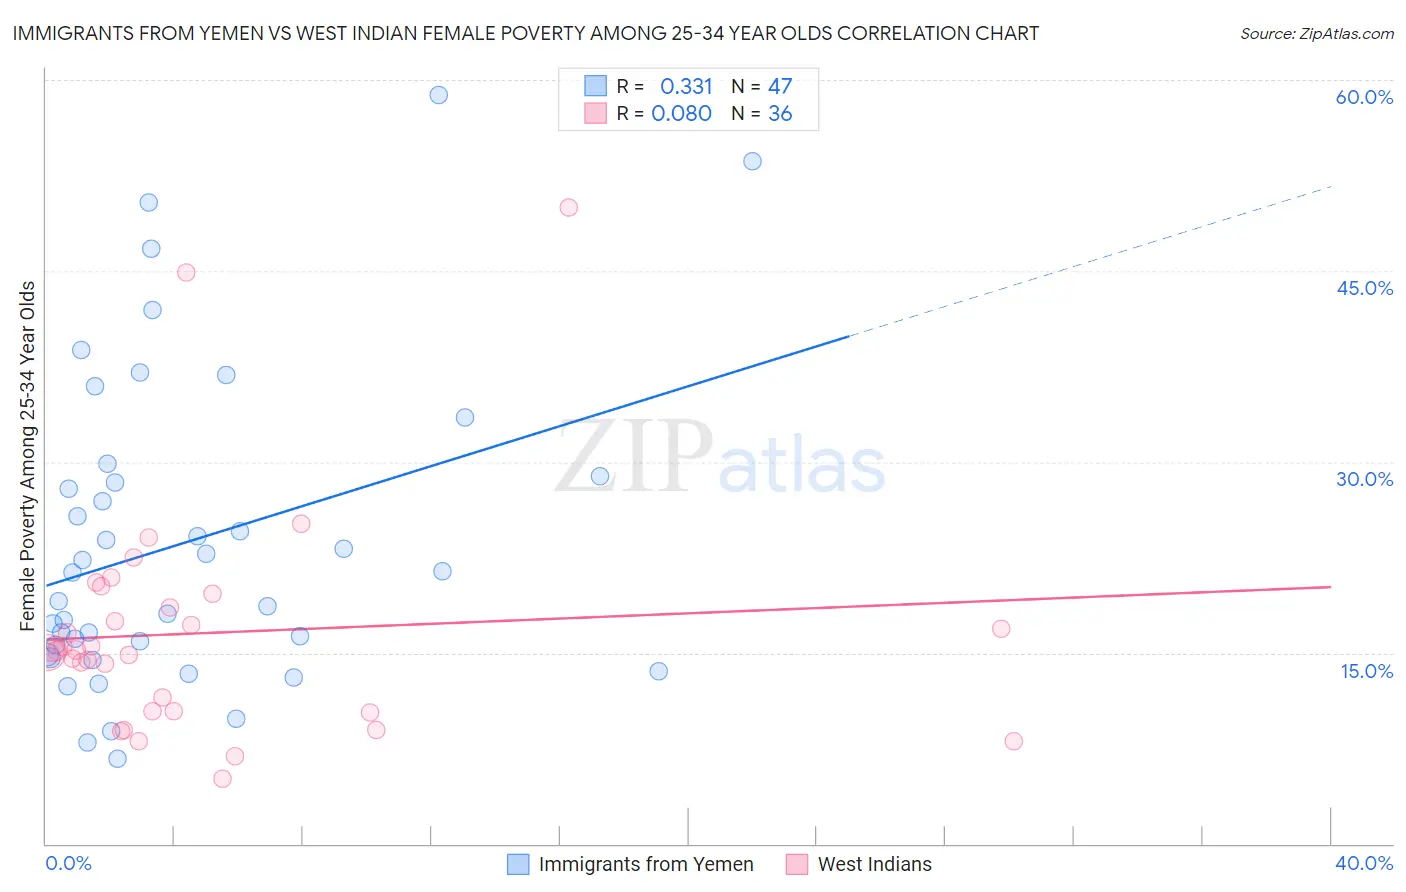
Immigrants from Yemen vs West Indian Female Poverty Among 25-34 Year Olds Correlation Chart
The statistical analysis conducted on geographies consisting of 82,247,545 people shows a mild positive correlation between the proportion of Immigrants from Yemen and poverty level among females between the ages 25 and 34 in the United States with a correlation coefficient (R) of 0.331 and weighted average of 19.8%. Similarly, the statistical analysis conducted on geographies consisting of 252,060,649 people shows a slight positive correlation between the proportion of West Indians and poverty level among females between the ages 25 and 34 in the United States with a correlation coefficient (R) of 0.080 and weighted average of 15.2%, a difference of 30.3%.
Female Poverty Among 25-34 Year Olds Correlation Summary
| Measurement | Immigrants from Yemen | West Indian |
| Minimum | 6.7% | 5.1% |
| Maximum | 58.8% | 50.0% |
| Range | 52.2% | 44.9% |
| Mean | 23.7% | 16.5% |
| Median | 21.3% | 15.2% |
| Interquartile 25% (IQ1) | 14.9% | 10.4% |
| Interquartile 75% (IQ3) | 28.9% | 19.1% |
| Interquartile Range (IQR) | 14.0% | 8.7% |
| Standard Deviation (Sample) | 12.3% | 9.0% |
| Standard Deviation (Population) | 12.1% | 8.9% |
Similar Demographics by Female Poverty Among 25-34 Year Olds
Demographics Similar to Immigrants from Yemen by Female Poverty Among 25-34 Year Olds
In terms of female poverty among 25-34 year olds, the demographic groups most similar to Immigrants from Yemen are Kiowa (19.7%, a difference of 0.59%), Cajun (19.9%, a difference of 0.80%), Paiute (19.6%, a difference of 1.0%), Apache (20.1%, a difference of 1.5%), and Native/Alaskan (20.3%, a difference of 2.6%).
| Demographics | Rating | Rank | Female Poverty Among 25-34 Year Olds |
| Inupiat | 0.0 /100 | #325 | Tragic 18.5% |
| Blacks/African Americans | 0.0 /100 | #326 | Tragic 18.9% |
| Cheyenne | 0.0 /100 | #327 | Tragic 19.1% |
| Alaskan Athabascans | 0.0 /100 | #328 | Tragic 19.1% |
| Creek | 0.0 /100 | #329 | Tragic 19.2% |
| Paiute | 0.0 /100 | #330 | Tragic 19.6% |
| Kiowa | 0.0 /100 | #331 | Tragic 19.7% |
| Immigrants | Yemen | 0.0 /100 | #332 | Tragic 19.8% |
| Cajuns | 0.0 /100 | #333 | Tragic 19.9% |
| Apache | 0.0 /100 | #334 | Tragic 20.1% |
| Natives/Alaskans | 0.0 /100 | #335 | Tragic 20.3% |
| Pueblo | 0.0 /100 | #336 | Tragic 22.2% |
| Crow | 0.0 /100 | #337 | Tragic 22.7% |
| Houma | 0.0 /100 | #338 | Tragic 22.7% |
| Yuman | 0.0 /100 | #339 | Tragic 22.9% |
Demographics Similar to West Indians by Female Poverty Among 25-34 Year Olds
In terms of female poverty among 25-34 year olds, the demographic groups most similar to West Indians are Immigrants from Burma/Myanmar (15.2%, a difference of 0.020%), Immigrants from Laos (15.2%, a difference of 0.17%), Nepalese (15.2%, a difference of 0.28%), Immigrants from Cuba (15.2%, a difference of 0.30%), and Somali (15.1%, a difference of 0.55%).
| Demographics | Rating | Rank | Female Poverty Among 25-34 Year Olds |
| Immigrants | Haiti | 0.5 /100 | #249 | Tragic 15.0% |
| Immigrants | El Salvador | 0.5 /100 | #250 | Tragic 15.0% |
| Haitians | 0.5 /100 | #251 | Tragic 15.0% |
| Belizeans | 0.4 /100 | #252 | Tragic 15.1% |
| Immigrants | West Indies | 0.4 /100 | #253 | Tragic 15.1% |
| Somalis | 0.4 /100 | #254 | Tragic 15.1% |
| Immigrants | Laos | 0.3 /100 | #255 | Tragic 15.2% |
| West Indians | 0.3 /100 | #256 | Tragic 15.2% |
| Immigrants | Burma/Myanmar | 0.3 /100 | #257 | Tragic 15.2% |
| Nepalese | 0.2 /100 | #258 | Tragic 15.2% |
| Immigrants | Cuba | 0.2 /100 | #259 | Tragic 15.2% |
| Marshallese | 0.2 /100 | #260 | Tragic 15.3% |
| Liberians | 0.2 /100 | #261 | Tragic 15.3% |
| Immigrants | Belize | 0.2 /100 | #262 | Tragic 15.3% |
| Mexican American Indians | 0.2 /100 | #263 | Tragic 15.4% |