Immigrants from Nepal vs Immigrants from Eritrea Female Poverty Among 25-34 Year Olds
COMPARE
Immigrants from Nepal
Immigrants from Eritrea
Female Poverty Among 25-34 Year Olds
Female Poverty Among 25-34 Year Olds Comparison
Immigrants from Nepal
Immigrants from Eritrea
12.8%
FEMALE POVERTY AMONG 25-34 YEAR OLDS
93.0/ 100
METRIC RATING
119th/ 347
METRIC RANK
13.7%
FEMALE POVERTY AMONG 25-34 YEAR OLDS
32.7/ 100
METRIC RATING
188th/ 347
METRIC RANK
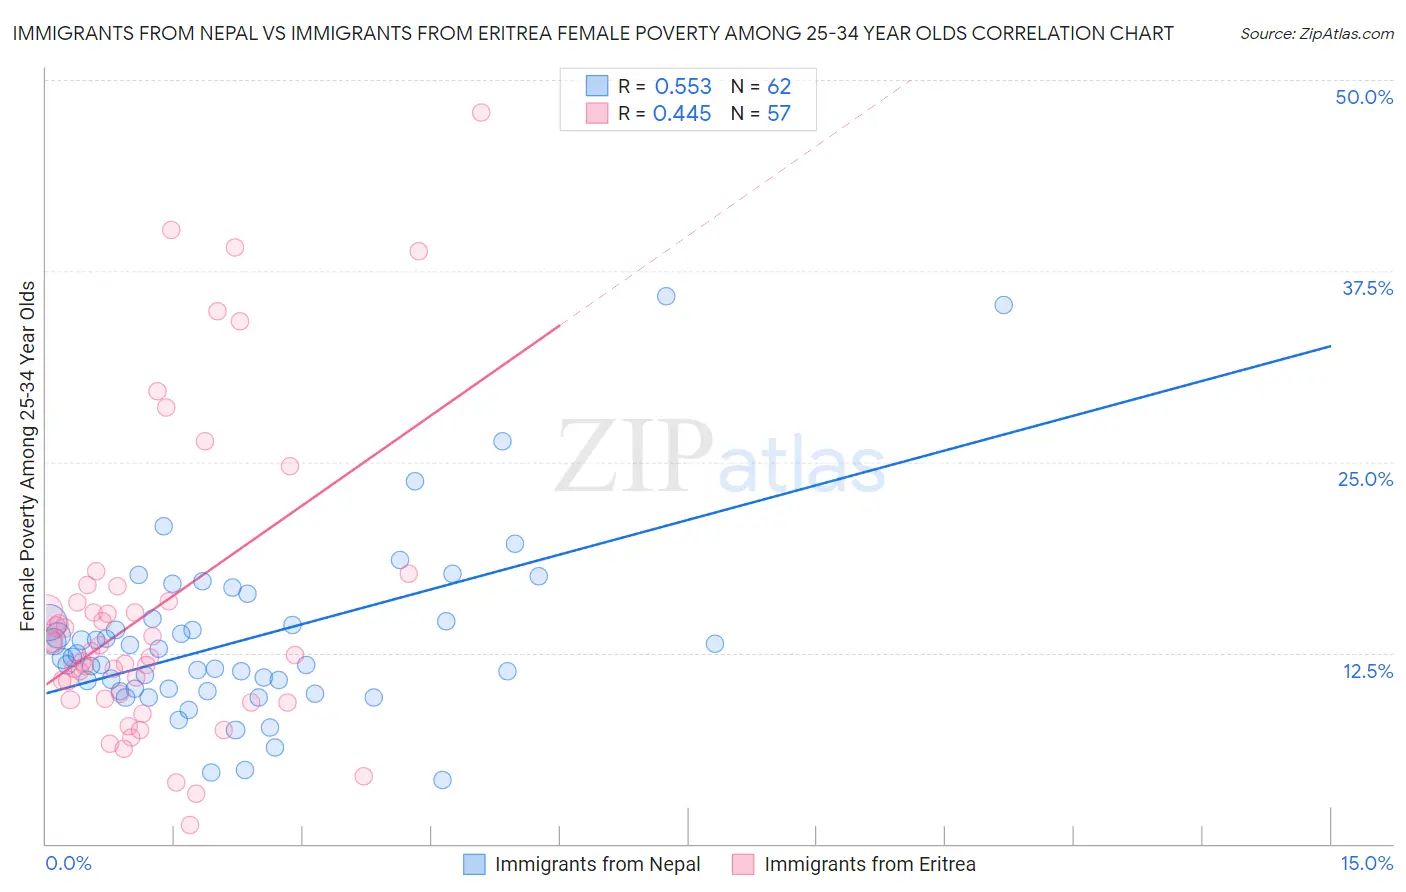
Immigrants from Nepal vs Immigrants from Eritrea Female Poverty Among 25-34 Year Olds Correlation Chart
The statistical analysis conducted on geographies consisting of 185,514,428 people shows a substantial positive correlation between the proportion of Immigrants from Nepal and poverty level among females between the ages 25 and 34 in the United States with a correlation coefficient (R) of 0.553 and weighted average of 12.8%. Similarly, the statistical analysis conducted on geographies consisting of 104,678,309 people shows a moderate positive correlation between the proportion of Immigrants from Eritrea and poverty level among females between the ages 25 and 34 in the United States with a correlation coefficient (R) of 0.445 and weighted average of 13.7%, a difference of 7.3%.
Female Poverty Among 25-34 Year Olds Correlation Summary
| Measurement | Immigrants from Nepal | Immigrants from Eritrea |
| Minimum | 4.2% | 1.2% |
| Maximum | 35.9% | 47.9% |
| Range | 31.7% | 46.6% |
| Mean | 13.4% | 15.4% |
| Median | 12.1% | 12.6% |
| Interquartile 25% (IQ1) | 10.1% | 9.5% |
| Interquartile 75% (IQ3) | 14.5% | 16.4% |
| Interquartile Range (IQR) | 4.4% | 6.9% |
| Standard Deviation (Sample) | 5.8% | 10.0% |
| Standard Deviation (Population) | 5.8% | 9.9% |
Similar Demographics by Female Poverty Among 25-34 Year Olds
Demographics Similar to Immigrants from Nepal by Female Poverty Among 25-34 Year Olds
In terms of female poverty among 25-34 year olds, the demographic groups most similar to Immigrants from Nepal are Carpatho Rusyn (12.8%, a difference of 0.0%), Mongolian (12.8%, a difference of 0.010%), Immigrants from Kuwait (12.8%, a difference of 0.020%), Romanian (12.8%, a difference of 0.070%), and Chilean (12.8%, a difference of 0.080%).
| Demographics | Rating | Rank | Female Poverty Among 25-34 Year Olds |
| Immigrants | Morocco | 93.9 /100 | #112 | Exceptional 12.8% |
| Immigrants | Syria | 93.8 /100 | #113 | Exceptional 12.8% |
| Immigrants | Southern Europe | 93.6 /100 | #114 | Exceptional 12.8% |
| Immigrants | Brazil | 93.3 /100 | #115 | Exceptional 12.8% |
| Chileans | 93.2 /100 | #116 | Exceptional 12.8% |
| Immigrants | Kuwait | 93.1 /100 | #117 | Exceptional 12.8% |
| Mongolians | 93.0 /100 | #118 | Exceptional 12.8% |
| Immigrants | Nepal | 93.0 /100 | #119 | Exceptional 12.8% |
| Carpatho Rusyns | 93.0 /100 | #120 | Exceptional 12.8% |
| Romanians | 92.8 /100 | #121 | Exceptional 12.8% |
| Immigrants | Western Asia | 92.7 /100 | #122 | Exceptional 12.8% |
| Slovenes | 92.7 /100 | #123 | Exceptional 12.8% |
| Immigrants | Netherlands | 92.0 /100 | #124 | Exceptional 12.8% |
| Immigrants | Canada | 91.5 /100 | #125 | Exceptional 12.9% |
| Immigrants | Fiji | 91.2 /100 | #126 | Exceptional 12.9% |
Demographics Similar to Immigrants from Eritrea by Female Poverty Among 25-34 Year Olds
In terms of female poverty among 25-34 year olds, the demographic groups most similar to Immigrants from Eritrea are Finnish (13.7%, a difference of 0.020%), Immigrants from Uruguay (13.7%, a difference of 0.13%), Slovak (13.7%, a difference of 0.13%), Irish (13.7%, a difference of 0.24%), and Dutch (13.8%, a difference of 0.28%).
| Demographics | Rating | Rank | Female Poverty Among 25-34 Year Olds |
| Guamanians/Chamorros | 41.5 /100 | #181 | Average 13.6% |
| Immigrants | Venezuela | 40.7 /100 | #182 | Average 13.6% |
| Portuguese | 40.3 /100 | #183 | Average 13.6% |
| Czechoslovakians | 36.8 /100 | #184 | Fair 13.7% |
| Irish | 35.3 /100 | #185 | Fair 13.7% |
| Immigrants | Uruguay | 34.1 /100 | #186 | Fair 13.7% |
| Slovaks | 34.1 /100 | #187 | Fair 13.7% |
| Immigrants | Eritrea | 32.7 /100 | #188 | Fair 13.7% |
| Finns | 32.5 /100 | #189 | Fair 13.7% |
| Dutch | 29.7 /100 | #190 | Fair 13.8% |
| Immigrants | St. Vincent and the Grenadines | 29.3 /100 | #191 | Fair 13.8% |
| Tlingit-Haida | 28.1 /100 | #192 | Fair 13.8% |
| Immigrants | Kenya | 28.0 /100 | #193 | Fair 13.8% |
| Moroccans | 25.1 /100 | #194 | Fair 13.8% |
| Immigrants | Cambodia | 24.0 /100 | #195 | Fair 13.9% |