Immigrants from Nepal vs Guatemalan Female Poverty Among 25-34 Year Olds
COMPARE
Immigrants from Nepal
Guatemalan
Female Poverty Among 25-34 Year Olds
Female Poverty Among 25-34 Year Olds Comparison
Immigrants from Nepal
Guatemalans
12.8%
FEMALE POVERTY AMONG 25-34 YEAR OLDS
93.0/ 100
METRIC RATING
119th/ 347
METRIC RANK
16.4%
FEMALE POVERTY AMONG 25-34 YEAR OLDS
0.0/ 100
METRIC RATING
288th/ 347
METRIC RANK
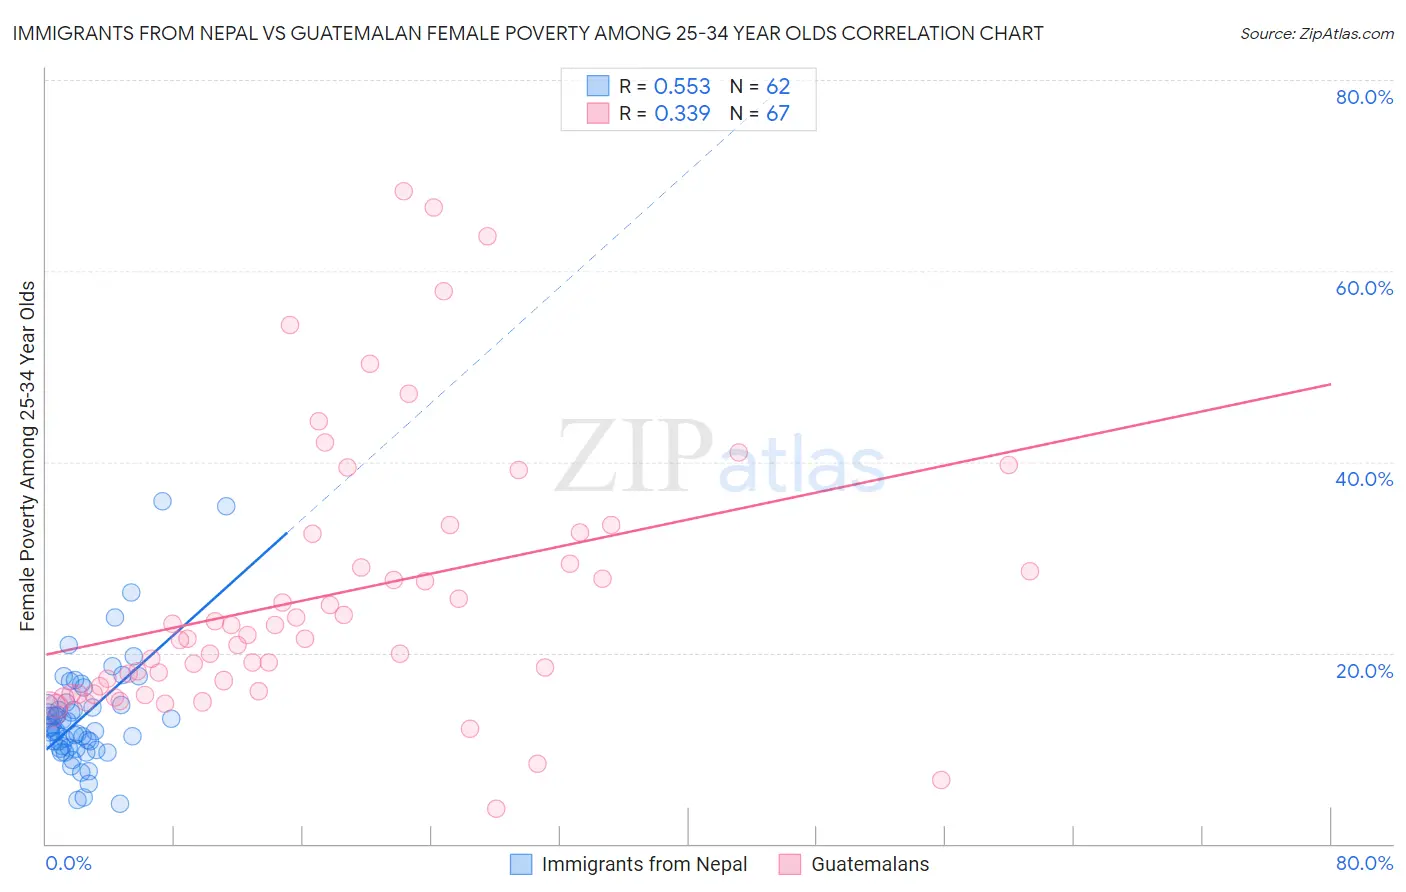
Immigrants from Nepal vs Guatemalan Female Poverty Among 25-34 Year Olds Correlation Chart
The statistical analysis conducted on geographies consisting of 185,514,428 people shows a substantial positive correlation between the proportion of Immigrants from Nepal and poverty level among females between the ages 25 and 34 in the United States with a correlation coefficient (R) of 0.553 and weighted average of 12.8%. Similarly, the statistical analysis conducted on geographies consisting of 404,378,710 people shows a mild positive correlation between the proportion of Guatemalans and poverty level among females between the ages 25 and 34 in the United States with a correlation coefficient (R) of 0.339 and weighted average of 16.4%, a difference of 28.0%.
Female Poverty Among 25-34 Year Olds Correlation Summary
| Measurement | Immigrants from Nepal | Guatemalan |
| Minimum | 4.2% | 3.7% |
| Maximum | 35.9% | 68.3% |
| Range | 31.7% | 64.6% |
| Mean | 13.4% | 26.0% |
| Median | 12.1% | 21.5% |
| Interquartile 25% (IQ1) | 10.1% | 15.9% |
| Interquartile 75% (IQ3) | 14.5% | 32.4% |
| Interquartile Range (IQR) | 4.4% | 16.5% |
| Standard Deviation (Sample) | 5.8% | 14.1% |
| Standard Deviation (Population) | 5.8% | 14.0% |
Similar Demographics by Female Poverty Among 25-34 Year Olds
Demographics Similar to Immigrants from Nepal by Female Poverty Among 25-34 Year Olds
In terms of female poverty among 25-34 year olds, the demographic groups most similar to Immigrants from Nepal are Carpatho Rusyn (12.8%, a difference of 0.0%), Mongolian (12.8%, a difference of 0.010%), Immigrants from Kuwait (12.8%, a difference of 0.020%), Romanian (12.8%, a difference of 0.070%), and Chilean (12.8%, a difference of 0.080%).
| Demographics | Rating | Rank | Female Poverty Among 25-34 Year Olds |
| Immigrants | Morocco | 93.9 /100 | #112 | Exceptional 12.8% |
| Immigrants | Syria | 93.8 /100 | #113 | Exceptional 12.8% |
| Immigrants | Southern Europe | 93.6 /100 | #114 | Exceptional 12.8% |
| Immigrants | Brazil | 93.3 /100 | #115 | Exceptional 12.8% |
| Chileans | 93.2 /100 | #116 | Exceptional 12.8% |
| Immigrants | Kuwait | 93.1 /100 | #117 | Exceptional 12.8% |
| Mongolians | 93.0 /100 | #118 | Exceptional 12.8% |
| Immigrants | Nepal | 93.0 /100 | #119 | Exceptional 12.8% |
| Carpatho Rusyns | 93.0 /100 | #120 | Exceptional 12.8% |
| Romanians | 92.8 /100 | #121 | Exceptional 12.8% |
| Immigrants | Western Asia | 92.7 /100 | #122 | Exceptional 12.8% |
| Slovenes | 92.7 /100 | #123 | Exceptional 12.8% |
| Immigrants | Netherlands | 92.0 /100 | #124 | Exceptional 12.8% |
| Immigrants | Canada | 91.5 /100 | #125 | Exceptional 12.9% |
| Immigrants | Fiji | 91.2 /100 | #126 | Exceptional 12.9% |
Demographics Similar to Guatemalans by Female Poverty Among 25-34 Year Olds
In terms of female poverty among 25-34 year olds, the demographic groups most similar to Guatemalans are Osage (16.4%, a difference of 0.060%), American (16.4%, a difference of 0.19%), Indonesian (16.4%, a difference of 0.22%), Cape Verdean (16.3%, a difference of 0.24%), and Immigrants from Bahamas (16.3%, a difference of 0.42%).
| Demographics | Rating | Rank | Female Poverty Among 25-34 Year Olds |
| Immigrants | Latin America | 0.0 /100 | #281 | Tragic 16.0% |
| Aleuts | 0.0 /100 | #282 | Tragic 16.1% |
| Bahamians | 0.0 /100 | #283 | Tragic 16.1% |
| Shoshone | 0.0 /100 | #284 | Tragic 16.2% |
| Immigrants | Bahamas | 0.0 /100 | #285 | Tragic 16.3% |
| Cape Verdeans | 0.0 /100 | #286 | Tragic 16.3% |
| Americans | 0.0 /100 | #287 | Tragic 16.4% |
| Guatemalans | 0.0 /100 | #288 | Tragic 16.4% |
| Osage | 0.0 /100 | #289 | Tragic 16.4% |
| Indonesians | 0.0 /100 | #290 | Tragic 16.4% |
| Comanche | 0.0 /100 | #291 | Tragic 16.5% |
| Immigrants | Dominica | 0.0 /100 | #292 | Tragic 16.5% |
| Potawatomi | 0.0 /100 | #293 | Tragic 16.5% |
| Immigrants | Central America | 0.0 /100 | #294 | Tragic 16.6% |
| Mexicans | 0.0 /100 | #295 | Tragic 16.6% |