Immigrants from Nepal vs Immigrants from Bosnia and Herzegovina Female Poverty Among 25-34 Year Olds
COMPARE
Immigrants from Nepal
Immigrants from Bosnia and Herzegovina
Female Poverty Among 25-34 Year Olds
Female Poverty Among 25-34 Year Olds Comparison
Immigrants from Nepal
Immigrants from Bosnia and Herzegovina
12.8%
FEMALE POVERTY AMONG 25-34 YEAR OLDS
93.0/ 100
METRIC RATING
119th/ 347
METRIC RANK
13.4%
FEMALE POVERTY AMONG 25-34 YEAR OLDS
58.6/ 100
METRIC RATING
167th/ 347
METRIC RANK
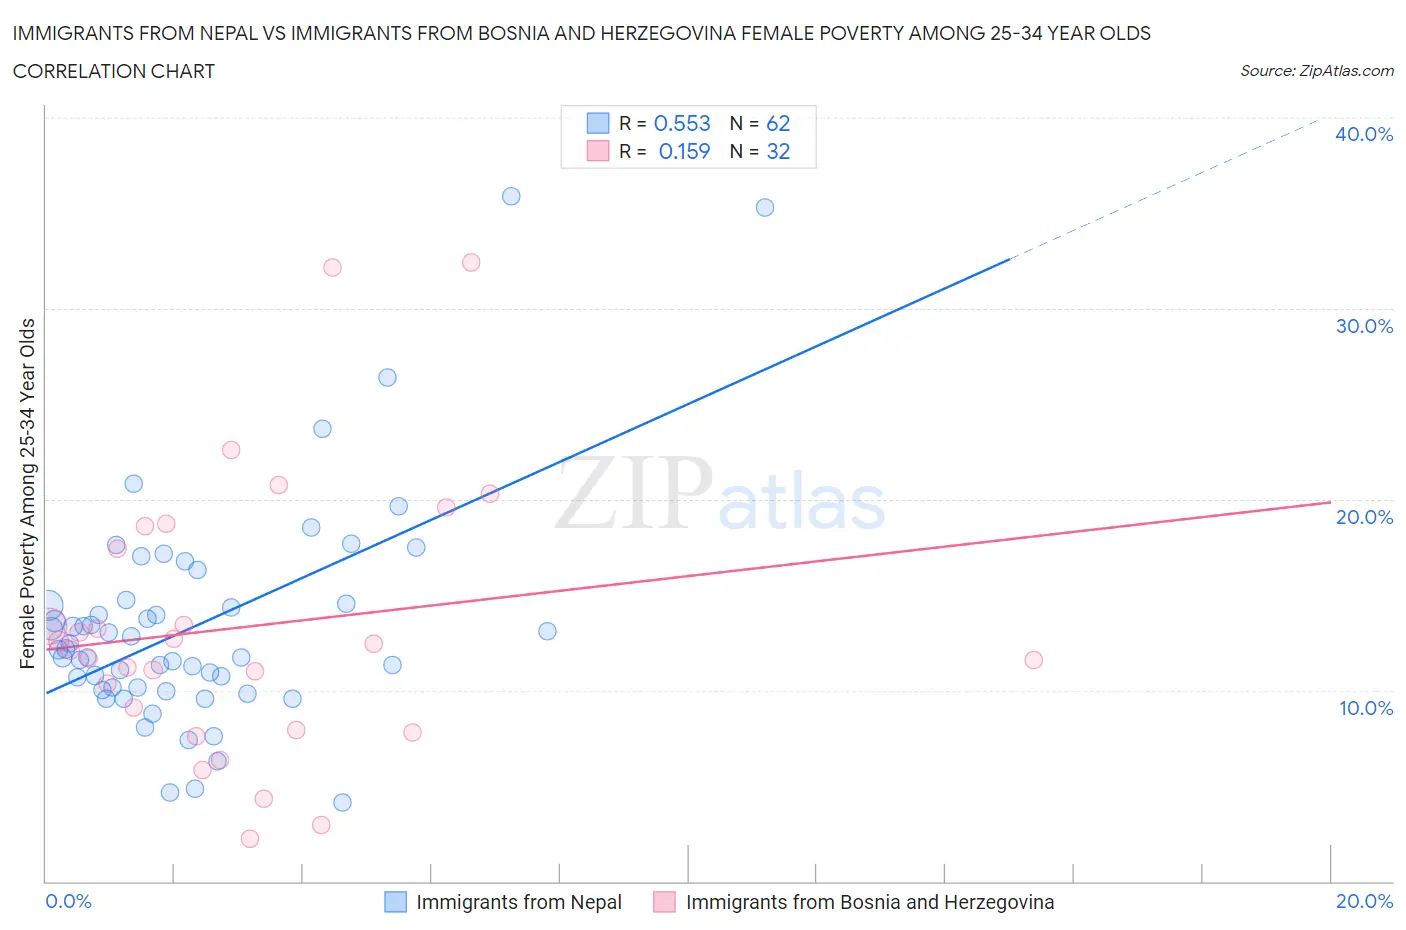
Immigrants from Nepal vs Immigrants from Bosnia and Herzegovina Female Poverty Among 25-34 Year Olds Correlation Chart
The statistical analysis conducted on geographies consisting of 185,514,428 people shows a substantial positive correlation between the proportion of Immigrants from Nepal and poverty level among females between the ages 25 and 34 in the United States with a correlation coefficient (R) of 0.553 and weighted average of 12.8%. Similarly, the statistical analysis conducted on geographies consisting of 155,781,915 people shows a poor positive correlation between the proportion of Immigrants from Bosnia and Herzegovina and poverty level among females between the ages 25 and 34 in the United States with a correlation coefficient (R) of 0.159 and weighted average of 13.4%, a difference of 4.9%.
Female Poverty Among 25-34 Year Olds Correlation Summary
| Measurement | Immigrants from Nepal | Immigrants from Bosnia and Herzegovina |
| Minimum | 4.2% | 2.2% |
| Maximum | 35.9% | 32.4% |
| Range | 31.7% | 30.2% |
| Mean | 13.4% | 13.3% |
| Median | 12.1% | 12.2% |
| Interquartile 25% (IQ1) | 10.1% | 8.5% |
| Interquartile 75% (IQ3) | 14.5% | 18.0% |
| Interquartile Range (IQR) | 4.4% | 9.5% |
| Standard Deviation (Sample) | 5.8% | 7.1% |
| Standard Deviation (Population) | 5.8% | 7.0% |
Similar Demographics by Female Poverty Among 25-34 Year Olds
Demographics Similar to Immigrants from Nepal by Female Poverty Among 25-34 Year Olds
In terms of female poverty among 25-34 year olds, the demographic groups most similar to Immigrants from Nepal are Carpatho Rusyn (12.8%, a difference of 0.0%), Mongolian (12.8%, a difference of 0.010%), Immigrants from Kuwait (12.8%, a difference of 0.020%), Romanian (12.8%, a difference of 0.070%), and Chilean (12.8%, a difference of 0.080%).
| Demographics | Rating | Rank | Female Poverty Among 25-34 Year Olds |
| Immigrants | Morocco | 93.9 /100 | #112 | Exceptional 12.8% |
| Immigrants | Syria | 93.8 /100 | #113 | Exceptional 12.8% |
| Immigrants | Southern Europe | 93.6 /100 | #114 | Exceptional 12.8% |
| Immigrants | Brazil | 93.3 /100 | #115 | Exceptional 12.8% |
| Chileans | 93.2 /100 | #116 | Exceptional 12.8% |
| Immigrants | Kuwait | 93.1 /100 | #117 | Exceptional 12.8% |
| Mongolians | 93.0 /100 | #118 | Exceptional 12.8% |
| Immigrants | Nepal | 93.0 /100 | #119 | Exceptional 12.8% |
| Carpatho Rusyns | 93.0 /100 | #120 | Exceptional 12.8% |
| Romanians | 92.8 /100 | #121 | Exceptional 12.8% |
| Immigrants | Western Asia | 92.7 /100 | #122 | Exceptional 12.8% |
| Slovenes | 92.7 /100 | #123 | Exceptional 12.8% |
| Immigrants | Netherlands | 92.0 /100 | #124 | Exceptional 12.8% |
| Immigrants | Canada | 91.5 /100 | #125 | Exceptional 12.9% |
| Immigrants | Fiji | 91.2 /100 | #126 | Exceptional 12.9% |
Demographics Similar to Immigrants from Bosnia and Herzegovina by Female Poverty Among 25-34 Year Olds
In terms of female poverty among 25-34 year olds, the demographic groups most similar to Immigrants from Bosnia and Herzegovina are Belgian (13.4%, a difference of 0.020%), Basque (13.4%, a difference of 0.060%), Immigrants from Afghanistan (13.4%, a difference of 0.080%), Samoan (13.5%, a difference of 0.16%), and Swiss (13.4%, a difference of 0.27%).
| Demographics | Rating | Rank | Female Poverty Among 25-34 Year Olds |
| Immigrants | South America | 66.3 /100 | #160 | Good 13.3% |
| Icelanders | 65.7 /100 | #161 | Good 13.3% |
| Ugandans | 64.1 /100 | #162 | Good 13.4% |
| British | 63.5 /100 | #163 | Good 13.4% |
| Swiss | 61.7 /100 | #164 | Good 13.4% |
| Basques | 59.3 /100 | #165 | Average 13.4% |
| Belgians | 58.9 /100 | #166 | Average 13.4% |
| Immigrants | Bosnia and Herzegovina | 58.6 /100 | #167 | Average 13.4% |
| Immigrants | Afghanistan | 57.7 /100 | #168 | Average 13.4% |
| Samoans | 56.8 /100 | #169 | Average 13.5% |
| Immigrants | Uganda | 53.0 /100 | #170 | Average 13.5% |
| South American Indians | 51.9 /100 | #171 | Average 13.5% |
| Immigrants | Costa Rica | 51.9 /100 | #172 | Average 13.5% |
| Kenyans | 51.8 /100 | #173 | Average 13.5% |
| Immigrants | Oceania | 50.0 /100 | #174 | Average 13.5% |