Immigrants from Nepal vs Immigrants from Cambodia Child Poverty Under the Age of 5
COMPARE
Immigrants from Nepal
Immigrants from Cambodia
Child Poverty Under the Age of 5
Child Poverty Under the Age of 5 Comparison
Immigrants from Nepal
Immigrants from Cambodia
16.6%
CHILD POVERTY UNDER THE AGE OF 5
80.3/ 100
METRIC RATING
147th/ 347
METRIC RANK
18.1%
CHILD POVERTY UNDER THE AGE OF 5
13.7/ 100
METRIC RATING
203rd/ 347
METRIC RANK
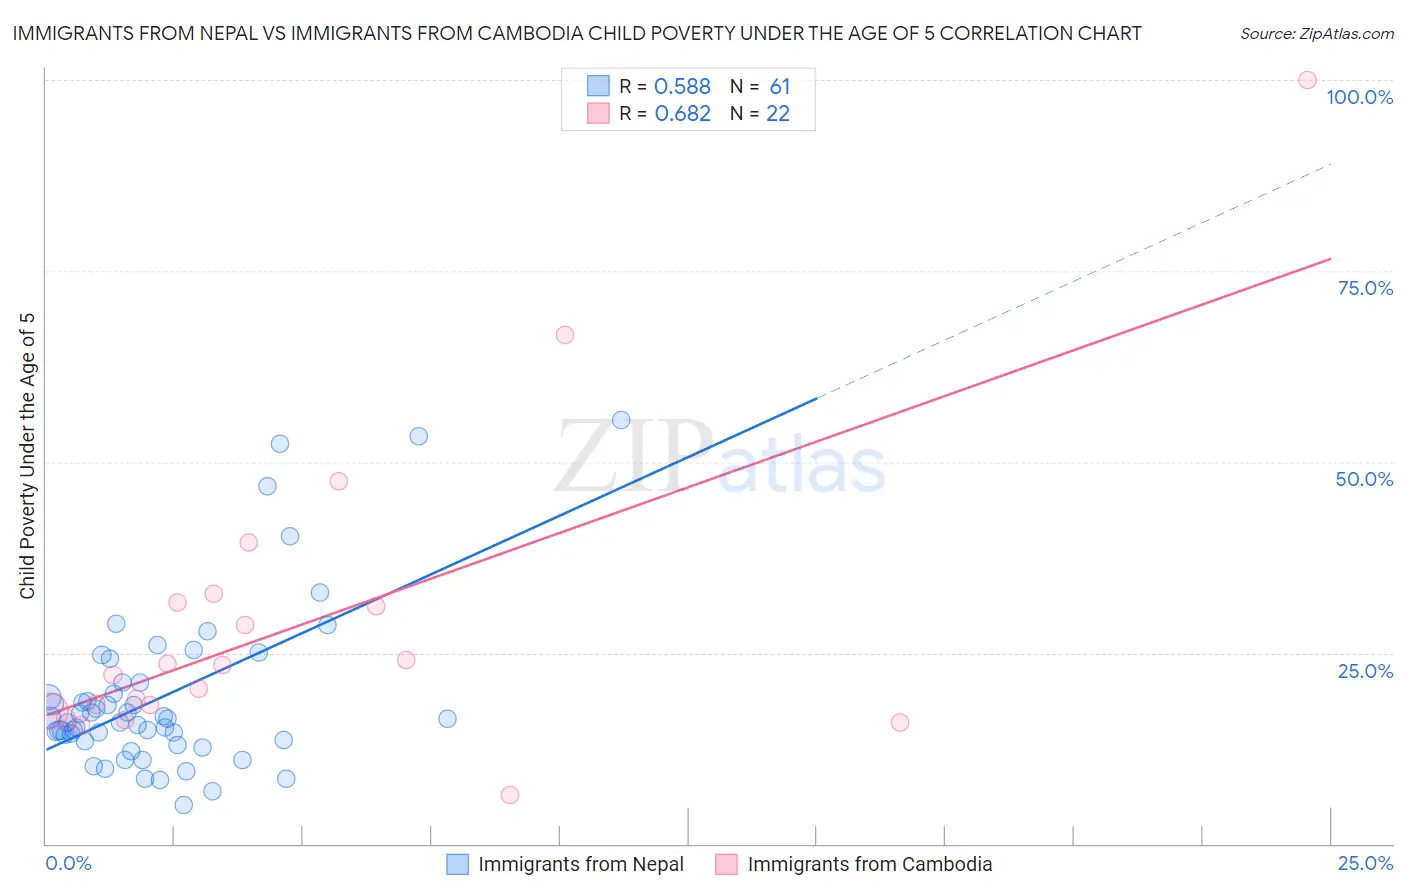
Immigrants from Nepal vs Immigrants from Cambodia Child Poverty Under the Age of 5 Correlation Chart
The statistical analysis conducted on geographies consisting of 183,030,738 people shows a substantial positive correlation between the proportion of Immigrants from Nepal and poverty level among children under the age of 5 in the United States with a correlation coefficient (R) of 0.588 and weighted average of 16.6%. Similarly, the statistical analysis conducted on geographies consisting of 201,266,142 people shows a significant positive correlation between the proportion of Immigrants from Cambodia and poverty level among children under the age of 5 in the United States with a correlation coefficient (R) of 0.682 and weighted average of 18.1%, a difference of 8.7%.
Child Poverty Under the Age of 5 Correlation Summary
| Measurement | Immigrants from Nepal | Immigrants from Cambodia |
| Minimum | 5.1% | 6.3% |
| Maximum | 55.6% | 100.0% |
| Range | 50.5% | 93.7% |
| Mean | 19.2% | 28.8% |
| Median | 16.4% | 22.7% |
| Interquartile 25% (IQ1) | 13.5% | 17.4% |
| Interquartile 75% (IQ3) | 21.2% | 31.6% |
| Interquartile Range (IQR) | 7.6% | 14.2% |
| Standard Deviation (Sample) | 10.9% | 20.5% |
| Standard Deviation (Population) | 10.8% | 20.0% |
Similar Demographics by Child Poverty Under the Age of 5
Demographics Similar to Immigrants from Nepal by Child Poverty Under the Age of 5
In terms of child poverty under the age of 5, the demographic groups most similar to Immigrants from Nepal are Syrian (16.6%, a difference of 0.19%), New Zealander (16.6%, a difference of 0.25%), Israeli (16.6%, a difference of 0.31%), Immigrants from Ethiopia (16.6%, a difference of 0.33%), and Colombian (16.7%, a difference of 0.40%).
| Demographics | Rating | Rank | Child Poverty Under the Age of 5 |
| Guamanians/Chamorros | 84.2 /100 | #140 | Excellent 16.5% |
| Immigrants | Western Europe | 83.3 /100 | #141 | Excellent 16.5% |
| Portuguese | 83.0 /100 | #142 | Excellent 16.5% |
| Samoans | 83.0 /100 | #143 | Excellent 16.5% |
| Ethiopians | 82.7 /100 | #144 | Excellent 16.5% |
| Immigrants | Ethiopia | 82.1 /100 | #145 | Excellent 16.6% |
| Israelis | 82.0 /100 | #146 | Excellent 16.6% |
| Immigrants | Nepal | 80.3 /100 | #147 | Excellent 16.6% |
| Syrians | 79.1 /100 | #148 | Good 16.6% |
| New Zealanders | 78.7 /100 | #149 | Good 16.6% |
| Colombians | 77.8 /100 | #150 | Good 16.7% |
| Canadians | 77.6 /100 | #151 | Good 16.7% |
| Belgians | 77.2 /100 | #152 | Good 16.7% |
| Dutch | 77.1 /100 | #153 | Good 16.7% |
| Immigrants | Venezuela | 76.0 /100 | #154 | Good 16.7% |
Demographics Similar to Immigrants from Cambodia by Child Poverty Under the Age of 5
In terms of child poverty under the age of 5, the demographic groups most similar to Immigrants from Cambodia are Japanese (18.1%, a difference of 0.020%), Ugandan (18.0%, a difference of 0.040%), Iraqi (18.0%, a difference of 0.050%), Immigrants from Eastern Africa (18.1%, a difference of 0.050%), and Spaniard (18.1%, a difference of 0.19%).
| Demographics | Rating | Rank | Child Poverty Under the Age of 5 |
| Immigrants | Portugal | 22.2 /100 | #196 | Fair 17.8% |
| Immigrants | Kenya | 20.0 /100 | #197 | Fair 17.9% |
| Celtics | 18.3 /100 | #198 | Poor 17.9% |
| Hungarians | 18.3 /100 | #199 | Poor 17.9% |
| Iraqis | 14.0 /100 | #200 | Poor 18.0% |
| Ugandans | 13.9 /100 | #201 | Poor 18.0% |
| Japanese | 13.8 /100 | #202 | Poor 18.1% |
| Immigrants | Cambodia | 13.7 /100 | #203 | Poor 18.1% |
| Immigrants | Eastern Africa | 13.4 /100 | #204 | Poor 18.1% |
| Spaniards | 12.8 /100 | #205 | Poor 18.1% |
| Whites/Caucasians | 12.6 /100 | #206 | Poor 18.1% |
| Immigrants | Immigrants | 9.9 /100 | #207 | Tragic 18.2% |
| Scotch-Irish | 9.8 /100 | #208 | Tragic 18.2% |
| Spanish | 9.8 /100 | #209 | Tragic 18.2% |
| Panamanians | 9.7 /100 | #210 | Tragic 18.2% |