French vs Immigrants from Cambodia Child Poverty Under the Age of 5
COMPARE
French
Immigrants from Cambodia
Child Poverty Under the Age of 5
Child Poverty Under the Age of 5 Comparison
French
Immigrants from Cambodia
17.5%
CHILD POVERTY UNDER THE AGE OF 5
33.6/ 100
METRIC RATING
189th/ 347
METRIC RANK
18.1%
CHILD POVERTY UNDER THE AGE OF 5
13.7/ 100
METRIC RATING
203rd/ 347
METRIC RANK
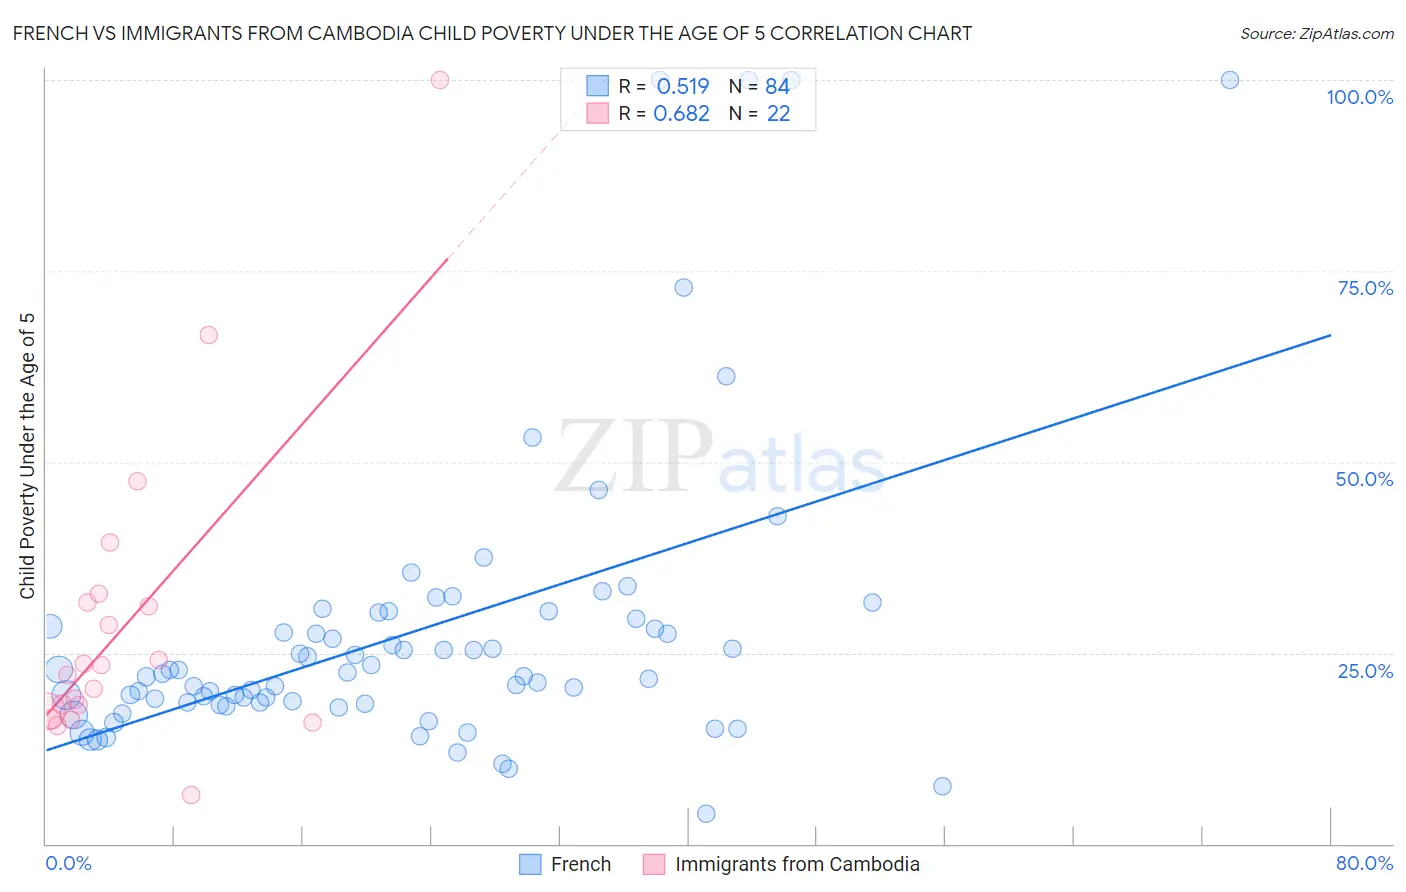
French vs Immigrants from Cambodia Child Poverty Under the Age of 5 Correlation Chart
The statistical analysis conducted on geographies consisting of 531,494,079 people shows a substantial positive correlation between the proportion of French and poverty level among children under the age of 5 in the United States with a correlation coefficient (R) of 0.519 and weighted average of 17.5%. Similarly, the statistical analysis conducted on geographies consisting of 201,266,142 people shows a significant positive correlation between the proportion of Immigrants from Cambodia and poverty level among children under the age of 5 in the United States with a correlation coefficient (R) of 0.682 and weighted average of 18.1%, a difference of 2.9%.
Child Poverty Under the Age of 5 Correlation Summary
| Measurement | French | Immigrants from Cambodia |
| Minimum | 4.0% | 6.3% |
| Maximum | 100.0% | 100.0% |
| Range | 96.0% | 93.7% |
| Mean | 27.5% | 28.8% |
| Median | 22.1% | 22.7% |
| Interquartile 25% (IQ1) | 18.4% | 17.4% |
| Interquartile 75% (IQ3) | 28.9% | 31.6% |
| Interquartile Range (IQR) | 10.5% | 14.2% |
| Standard Deviation (Sample) | 19.4% | 20.5% |
| Standard Deviation (Population) | 19.3% | 20.0% |
Demographics Similar to French and Immigrants from Cambodia by Child Poverty Under the Age of 5
In terms of child poverty under the age of 5, the demographic groups most similar to French are Carpatho Rusyn (17.5%, a difference of 0.010%), Kenyan (17.5%, a difference of 0.12%), Immigrants from Bosnia and Herzegovina (17.5%, a difference of 0.16%), Slovak (17.6%, a difference of 0.52%), and Immigrants from Afghanistan (17.7%, a difference of 0.69%). Similarly, the demographic groups most similar to Immigrants from Cambodia are Japanese (18.1%, a difference of 0.020%), Ugandan (18.0%, a difference of 0.040%), Iraqi (18.0%, a difference of 0.050%), Immigrants from Eastern Africa (18.1%, a difference of 0.050%), and Spaniard (18.1%, a difference of 0.19%).
| Demographics | Rating | Rank | Child Poverty Under the Age of 5 |
| Immigrants | Bosnia and Herzegovina | 35.0 /100 | #186 | Fair 17.5% |
| Kenyans | 34.7 /100 | #187 | Fair 17.5% |
| Carpatho Rusyns | 33.6 /100 | #188 | Fair 17.5% |
| French | 33.6 /100 | #189 | Fair 17.5% |
| Slovaks | 29.2 /100 | #190 | Fair 17.6% |
| Immigrants | Afghanistan | 27.9 /100 | #191 | Fair 17.7% |
| Immigrants | Uruguay | 27.8 /100 | #192 | Fair 17.7% |
| Immigrants | Uganda | 25.0 /100 | #193 | Fair 17.7% |
| French Canadians | 24.6 /100 | #194 | Fair 17.7% |
| Sierra Leoneans | 24.1 /100 | #195 | Fair 17.7% |
| Immigrants | Portugal | 22.2 /100 | #196 | Fair 17.8% |
| Immigrants | Kenya | 20.0 /100 | #197 | Fair 17.9% |
| Celtics | 18.3 /100 | #198 | Poor 17.9% |
| Hungarians | 18.3 /100 | #199 | Poor 17.9% |
| Iraqis | 14.0 /100 | #200 | Poor 18.0% |
| Ugandans | 13.9 /100 | #201 | Poor 18.0% |
| Japanese | 13.8 /100 | #202 | Poor 18.1% |
| Immigrants | Cambodia | 13.7 /100 | #203 | Poor 18.1% |
| Immigrants | Eastern Africa | 13.4 /100 | #204 | Poor 18.1% |
| Spaniards | 12.8 /100 | #205 | Poor 18.1% |
| Whites/Caucasians | 12.6 /100 | #206 | Poor 18.1% |