Immigrants from Nepal vs Immigrants from Sweden Child Poverty Under the Age of 5
COMPARE
Immigrants from Nepal
Immigrants from Sweden
Child Poverty Under the Age of 5
Child Poverty Under the Age of 5 Comparison
Immigrants from Nepal
Immigrants from Sweden
16.6%
CHILD POVERTY UNDER THE AGE OF 5
80.3/ 100
METRIC RATING
147th/ 347
METRIC RANK
15.3%
CHILD POVERTY UNDER THE AGE OF 5
98.8/ 100
METRIC RATING
72nd/ 347
METRIC RANK
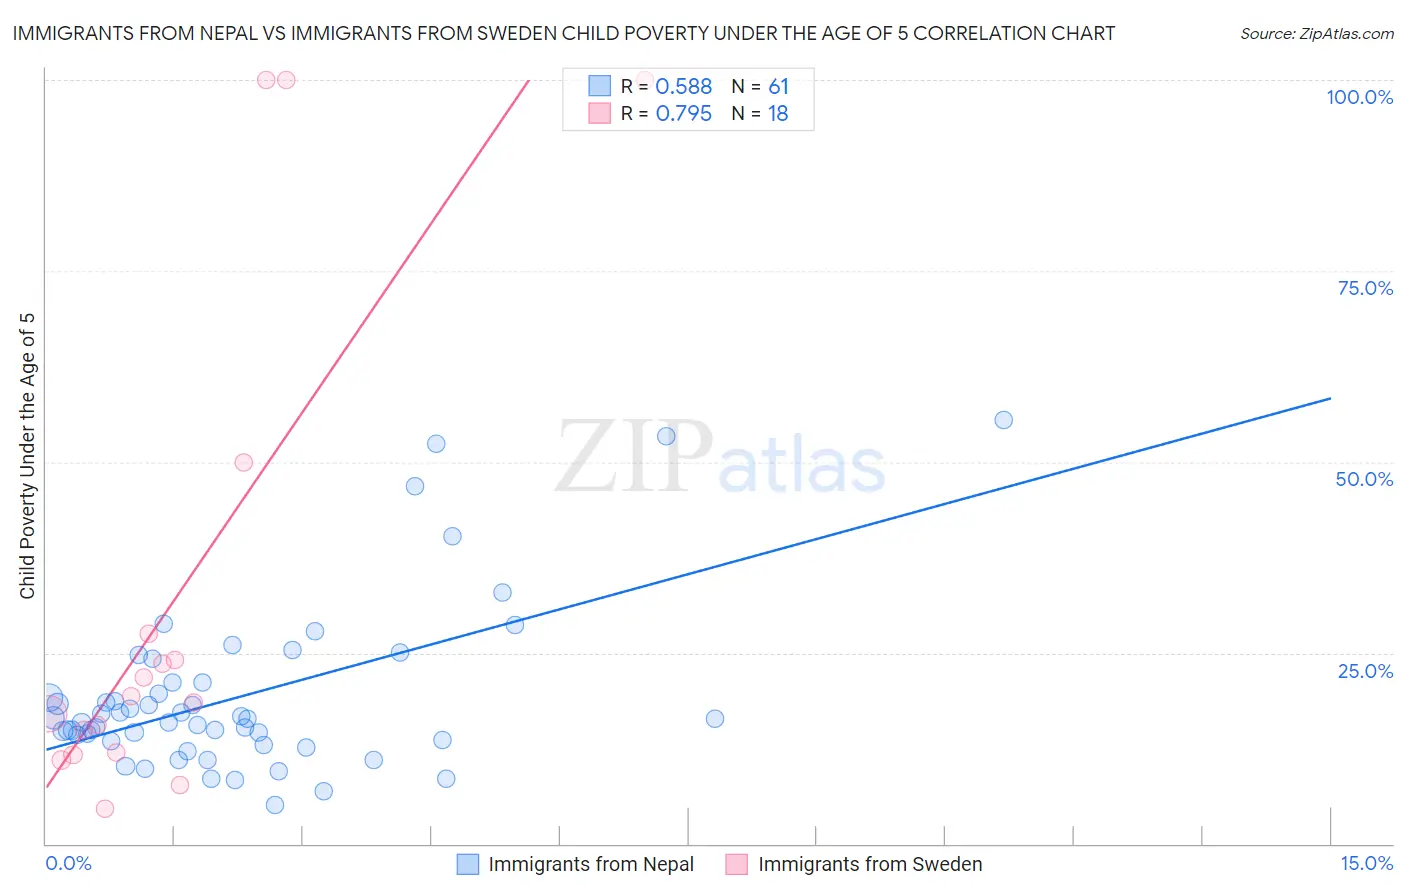
Immigrants from Nepal vs Immigrants from Sweden Child Poverty Under the Age of 5 Correlation Chart
The statistical analysis conducted on geographies consisting of 183,030,738 people shows a substantial positive correlation between the proportion of Immigrants from Nepal and poverty level among children under the age of 5 in the United States with a correlation coefficient (R) of 0.588 and weighted average of 16.6%. Similarly, the statistical analysis conducted on geographies consisting of 159,371,189 people shows a strong positive correlation between the proportion of Immigrants from Sweden and poverty level among children under the age of 5 in the United States with a correlation coefficient (R) of 0.795 and weighted average of 15.3%, a difference of 8.8%.
Child Poverty Under the Age of 5 Correlation Summary
| Measurement | Immigrants from Nepal | Immigrants from Sweden |
| Minimum | 5.1% | 4.7% |
| Maximum | 55.6% | 100.0% |
| Range | 50.5% | 95.3% |
| Mean | 19.2% | 32.2% |
| Median | 16.4% | 18.9% |
| Interquartile 25% (IQ1) | 13.5% | 12.0% |
| Interquartile 75% (IQ3) | 21.2% | 27.5% |
| Interquartile Range (IQR) | 7.6% | 15.4% |
| Standard Deviation (Sample) | 10.9% | 32.7% |
| Standard Deviation (Population) | 10.8% | 31.8% |
Similar Demographics by Child Poverty Under the Age of 5
Demographics Similar to Immigrants from Nepal by Child Poverty Under the Age of 5
In terms of child poverty under the age of 5, the demographic groups most similar to Immigrants from Nepal are Syrian (16.6%, a difference of 0.19%), New Zealander (16.6%, a difference of 0.25%), Israeli (16.6%, a difference of 0.31%), Immigrants from Ethiopia (16.6%, a difference of 0.33%), and Colombian (16.7%, a difference of 0.40%).
| Demographics | Rating | Rank | Child Poverty Under the Age of 5 |
| Guamanians/Chamorros | 84.2 /100 | #140 | Excellent 16.5% |
| Immigrants | Western Europe | 83.3 /100 | #141 | Excellent 16.5% |
| Portuguese | 83.0 /100 | #142 | Excellent 16.5% |
| Samoans | 83.0 /100 | #143 | Excellent 16.5% |
| Ethiopians | 82.7 /100 | #144 | Excellent 16.5% |
| Immigrants | Ethiopia | 82.1 /100 | #145 | Excellent 16.6% |
| Israelis | 82.0 /100 | #146 | Excellent 16.6% |
| Immigrants | Nepal | 80.3 /100 | #147 | Excellent 16.6% |
| Syrians | 79.1 /100 | #148 | Good 16.6% |
| New Zealanders | 78.7 /100 | #149 | Good 16.6% |
| Colombians | 77.8 /100 | #150 | Good 16.7% |
| Canadians | 77.6 /100 | #151 | Good 16.7% |
| Belgians | 77.2 /100 | #152 | Good 16.7% |
| Dutch | 77.1 /100 | #153 | Good 16.7% |
| Immigrants | Venezuela | 76.0 /100 | #154 | Good 16.7% |
Demographics Similar to Immigrants from Sweden by Child Poverty Under the Age of 5
In terms of child poverty under the age of 5, the demographic groups most similar to Immigrants from Sweden are Immigrants from Belgium (15.3%, a difference of 0.070%), Immigrants from Egypt (15.3%, a difference of 0.070%), Immigrants from Ukraine (15.3%, a difference of 0.23%), Lithuanian (15.2%, a difference of 0.50%), and Greek (15.2%, a difference of 0.52%).
| Demographics | Rating | Rank | Child Poverty Under the Age of 5 |
| Immigrants | Fiji | 99.0 /100 | #65 | Exceptional 15.2% |
| Immigrants | Scotland | 99.0 /100 | #66 | Exceptional 15.2% |
| Greeks | 99.0 /100 | #67 | Exceptional 15.2% |
| Zimbabweans | 99.0 /100 | #68 | Exceptional 15.2% |
| Lithuanians | 99.0 /100 | #69 | Exceptional 15.2% |
| Immigrants | Belgium | 98.8 /100 | #70 | Exceptional 15.3% |
| Immigrants | Egypt | 98.8 /100 | #71 | Exceptional 15.3% |
| Immigrants | Sweden | 98.8 /100 | #72 | Exceptional 15.3% |
| Immigrants | Ukraine | 98.7 /100 | #73 | Exceptional 15.3% |
| Argentineans | 98.5 /100 | #74 | Exceptional 15.4% |
| Immigrants | Argentina | 98.5 /100 | #75 | Exceptional 15.4% |
| Croatians | 98.5 /100 | #76 | Exceptional 15.4% |
| Immigrants | Turkey | 98.3 /100 | #77 | Exceptional 15.4% |
| Sri Lankans | 98.1 /100 | #78 | Exceptional 15.5% |
| Australians | 98.0 /100 | #79 | Exceptional 15.5% |