Immigrants from Fiji vs Immigrants from Cambodia Child Poverty Under the Age of 5
COMPARE
Immigrants from Fiji
Immigrants from Cambodia
Child Poverty Under the Age of 5
Child Poverty Under the Age of 5 Comparison
Immigrants from Fiji
Immigrants from Cambodia
15.2%
CHILD POVERTY UNDER THE AGE OF 5
99.0/ 100
METRIC RATING
65th/ 347
METRIC RANK
18.1%
CHILD POVERTY UNDER THE AGE OF 5
13.7/ 100
METRIC RATING
203rd/ 347
METRIC RANK
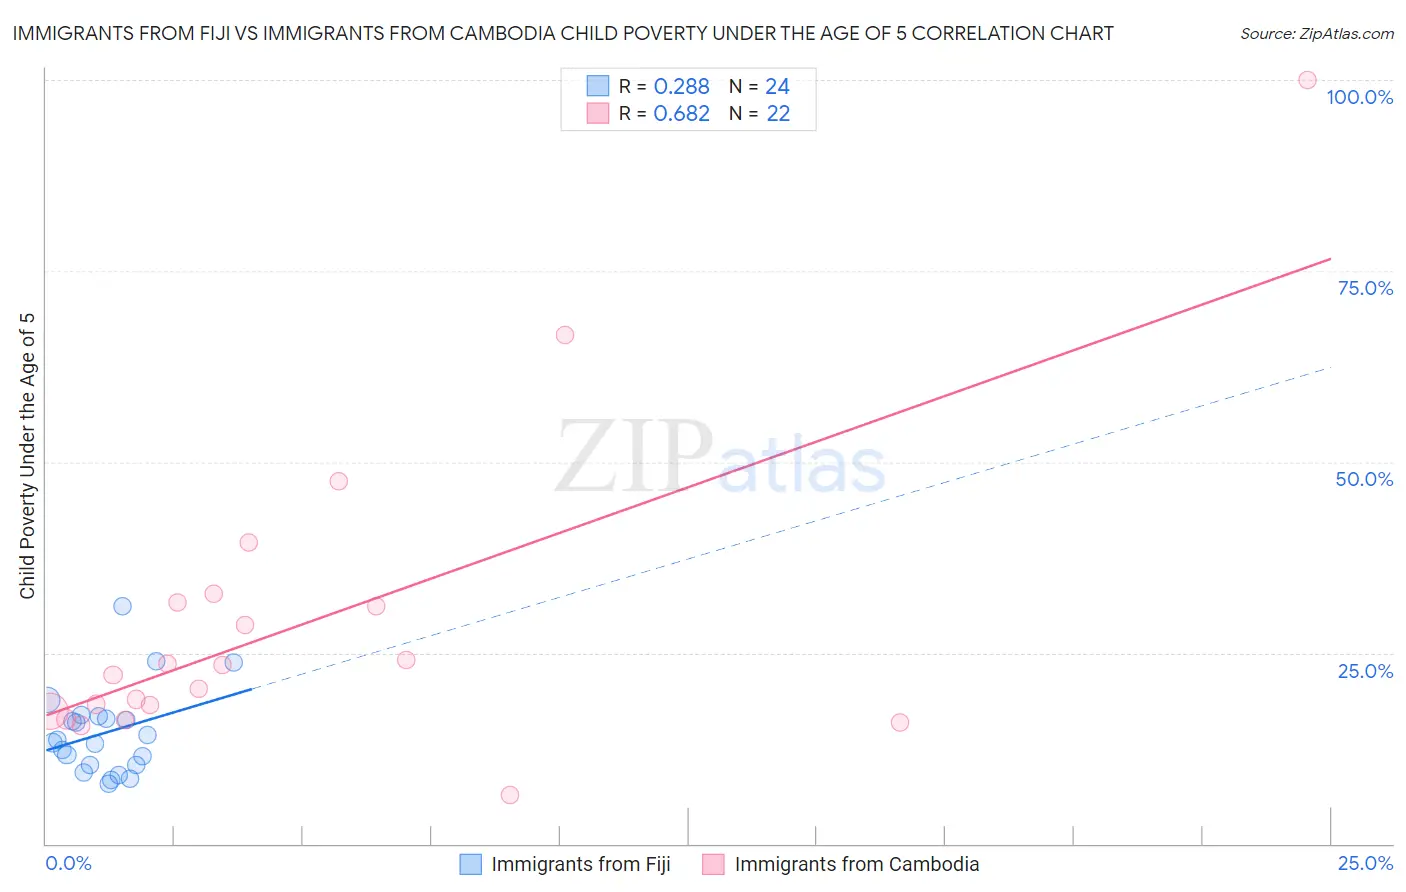
Immigrants from Fiji vs Immigrants from Cambodia Child Poverty Under the Age of 5 Correlation Chart
The statistical analysis conducted on geographies consisting of 92,816,757 people shows a weak positive correlation between the proportion of Immigrants from Fiji and poverty level among children under the age of 5 in the United States with a correlation coefficient (R) of 0.288 and weighted average of 15.2%. Similarly, the statistical analysis conducted on geographies consisting of 201,266,142 people shows a significant positive correlation between the proportion of Immigrants from Cambodia and poverty level among children under the age of 5 in the United States with a correlation coefficient (R) of 0.682 and weighted average of 18.1%, a difference of 19.1%.
Child Poverty Under the Age of 5 Correlation Summary
| Measurement | Immigrants from Fiji | Immigrants from Cambodia |
| Minimum | 7.8% | 6.3% |
| Maximum | 31.2% | 100.0% |
| Range | 23.4% | 93.7% |
| Mean | 14.5% | 28.8% |
| Median | 13.4% | 22.7% |
| Interquartile 25% (IQ1) | 10.3% | 17.4% |
| Interquartile 75% (IQ3) | 16.5% | 31.6% |
| Interquartile Range (IQR) | 6.3% | 14.2% |
| Standard Deviation (Sample) | 5.6% | 20.5% |
| Standard Deviation (Population) | 5.5% | 20.0% |
Similar Demographics by Child Poverty Under the Age of 5
Demographics Similar to Immigrants from Fiji by Child Poverty Under the Age of 5
In terms of child poverty under the age of 5, the demographic groups most similar to Immigrants from Fiji are Immigrants from Romania (15.2%, a difference of 0.030%), Immigrants from Europe (15.1%, a difference of 0.050%), Immigrants from Scotland (15.2%, a difference of 0.11%), Immigrants from Eastern Europe (15.1%, a difference of 0.18%), and Greek (15.2%, a difference of 0.18%).
| Demographics | Rating | Rank | Child Poverty Under the Age of 5 |
| Swedes | 99.4 /100 | #58 | Exceptional 15.0% |
| Paraguayans | 99.4 /100 | #59 | Exceptional 15.0% |
| Immigrants | Russia | 99.3 /100 | #60 | Exceptional 15.0% |
| Immigrants | Poland | 99.1 /100 | #61 | Exceptional 15.1% |
| Immigrants | Eastern Europe | 99.1 /100 | #62 | Exceptional 15.1% |
| Immigrants | Europe | 99.1 /100 | #63 | Exceptional 15.1% |
| Immigrants | Romania | 99.1 /100 | #64 | Exceptional 15.2% |
| Immigrants | Fiji | 99.0 /100 | #65 | Exceptional 15.2% |
| Immigrants | Scotland | 99.0 /100 | #66 | Exceptional 15.2% |
| Greeks | 99.0 /100 | #67 | Exceptional 15.2% |
| Zimbabweans | 99.0 /100 | #68 | Exceptional 15.2% |
| Lithuanians | 99.0 /100 | #69 | Exceptional 15.2% |
| Immigrants | Belgium | 98.8 /100 | #70 | Exceptional 15.3% |
| Immigrants | Egypt | 98.8 /100 | #71 | Exceptional 15.3% |
| Immigrants | Sweden | 98.8 /100 | #72 | Exceptional 15.3% |
Demographics Similar to Immigrants from Cambodia by Child Poverty Under the Age of 5
In terms of child poverty under the age of 5, the demographic groups most similar to Immigrants from Cambodia are Japanese (18.1%, a difference of 0.020%), Ugandan (18.0%, a difference of 0.040%), Iraqi (18.0%, a difference of 0.050%), Immigrants from Eastern Africa (18.1%, a difference of 0.050%), and Spaniard (18.1%, a difference of 0.19%).
| Demographics | Rating | Rank | Child Poverty Under the Age of 5 |
| Immigrants | Portugal | 22.2 /100 | #196 | Fair 17.8% |
| Immigrants | Kenya | 20.0 /100 | #197 | Fair 17.9% |
| Celtics | 18.3 /100 | #198 | Poor 17.9% |
| Hungarians | 18.3 /100 | #199 | Poor 17.9% |
| Iraqis | 14.0 /100 | #200 | Poor 18.0% |
| Ugandans | 13.9 /100 | #201 | Poor 18.0% |
| Japanese | 13.8 /100 | #202 | Poor 18.1% |
| Immigrants | Cambodia | 13.7 /100 | #203 | Poor 18.1% |
| Immigrants | Eastern Africa | 13.4 /100 | #204 | Poor 18.1% |
| Spaniards | 12.8 /100 | #205 | Poor 18.1% |
| Whites/Caucasians | 12.6 /100 | #206 | Poor 18.1% |
| Immigrants | Immigrants | 9.9 /100 | #207 | Tragic 18.2% |
| Scotch-Irish | 9.8 /100 | #208 | Tragic 18.2% |
| Spanish | 9.8 /100 | #209 | Tragic 18.2% |
| Panamanians | 9.7 /100 | #210 | Tragic 18.2% |