Immigrants from Micronesia vs Tlingit-Haida Single Male Poverty
COMPARE
Immigrants from Micronesia
Tlingit-Haida
Single Male Poverty
Single Male Poverty Comparison
Immigrants from Micronesia
Tlingit-Haida
13.5%
SINGLE MALE POVERTY
1.2/ 100
METRIC RATING
246th/ 347
METRIC RANK
11.6%
SINGLE MALE POVERTY
99.9/ 100
METRIC RATING
49th/ 347
METRIC RANK
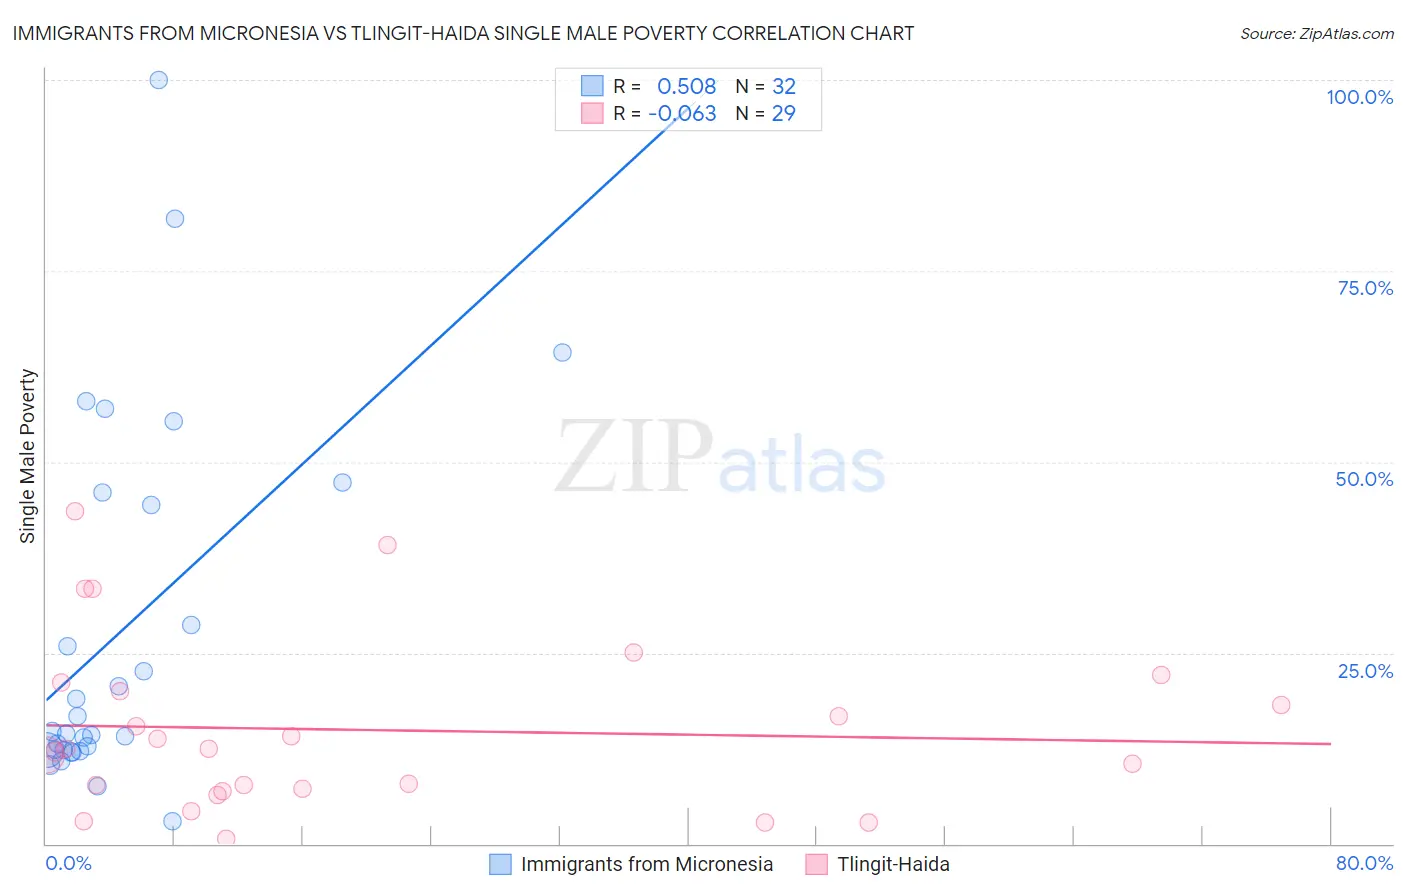
Immigrants from Micronesia vs Tlingit-Haida Single Male Poverty Correlation Chart
The statistical analysis conducted on geographies consisting of 60,290,539 people shows a substantial positive correlation between the proportion of Immigrants from Micronesia and poverty level among single males in the United States with a correlation coefficient (R) of 0.508 and weighted average of 13.5%. Similarly, the statistical analysis conducted on geographies consisting of 58,517,751 people shows a slight negative correlation between the proportion of Tlingit-Haida and poverty level among single males in the United States with a correlation coefficient (R) of -0.063 and weighted average of 11.6%, a difference of 16.7%.
Single Male Poverty Correlation Summary
| Measurement | Immigrants from Micronesia | Tlingit-Haida |
| Minimum | 3.0% | 0.66% |
| Maximum | 100.0% | 43.6% |
| Range | 97.0% | 43.0% |
| Mean | 27.8% | 14.9% |
| Median | 14.5% | 12.4% |
| Interquartile 25% (IQ1) | 12.2% | 7.1% |
| Interquartile 75% (IQ3) | 45.2% | 20.6% |
| Interquartile Range (IQR) | 32.9% | 13.5% |
| Standard Deviation (Sample) | 23.9% | 11.1% |
| Standard Deviation (Population) | 23.5% | 10.9% |
Similar Demographics by Single Male Poverty
Demographics Similar to Immigrants from Micronesia by Single Male Poverty
In terms of single male poverty, the demographic groups most similar to Immigrants from Micronesia are Belgian (13.5%, a difference of 0.010%), Czech (13.5%, a difference of 0.040%), Immigrants from Latin America (13.5%, a difference of 0.10%), Spanish (13.6%, a difference of 0.28%), and Immigrants from Somalia (13.6%, a difference of 0.30%).
| Demographics | Rating | Rank | Single Male Poverty |
| Czechoslovakians | 3.0 /100 | #239 | Tragic 13.4% |
| Belizeans | 2.3 /100 | #240 | Tragic 13.4% |
| Immigrants | Germany | 2.1 /100 | #241 | Tragic 13.4% |
| Carpatho Rusyns | 2.1 /100 | #242 | Tragic 13.4% |
| Barbadians | 2.1 /100 | #243 | Tragic 13.4% |
| Immigrants | Senegal | 1.7 /100 | #244 | Tragic 13.5% |
| Immigrants | Latin America | 1.3 /100 | #245 | Tragic 13.5% |
| Immigrants | Micronesia | 1.2 /100 | #246 | Tragic 13.5% |
| Belgians | 1.2 /100 | #247 | Tragic 13.5% |
| Czechs | 1.2 /100 | #248 | Tragic 13.5% |
| Spanish | 1.0 /100 | #249 | Tragic 13.6% |
| Immigrants | Somalia | 1.0 /100 | #250 | Tragic 13.6% |
| Immigrants | Zaire | 0.9 /100 | #251 | Tragic 13.6% |
| Finns | 0.9 /100 | #252 | Tragic 13.6% |
| German Russians | 0.8 /100 | #253 | Tragic 13.6% |
Demographics Similar to Tlingit-Haida by Single Male Poverty
In terms of single male poverty, the demographic groups most similar to Tlingit-Haida are Immigrants from Indonesia (11.6%, a difference of 0.020%), Immigrants from Lithuania (11.6%, a difference of 0.060%), Nepalese (11.6%, a difference of 0.10%), Paraguayan (11.6%, a difference of 0.17%), and Immigrants from Bulgaria (11.6%, a difference of 0.29%).
| Demographics | Rating | Rank | Single Male Poverty |
| Egyptians | 99.9 /100 | #42 | Exceptional 11.5% |
| Immigrants | Peru | 99.9 /100 | #43 | Exceptional 11.5% |
| Immigrants | Cameroon | 99.9 /100 | #44 | Exceptional 11.5% |
| Immigrants | Poland | 99.9 /100 | #45 | Exceptional 11.5% |
| Immigrants | Bulgaria | 99.9 /100 | #46 | Exceptional 11.6% |
| Nepalese | 99.9 /100 | #47 | Exceptional 11.6% |
| Immigrants | Indonesia | 99.9 /100 | #48 | Exceptional 11.6% |
| Tlingit-Haida | 99.9 /100 | #49 | Exceptional 11.6% |
| Immigrants | Lithuania | 99.9 /100 | #50 | Exceptional 11.6% |
| Paraguayans | 99.9 /100 | #51 | Exceptional 11.6% |
| Samoans | 99.9 /100 | #52 | Exceptional 11.7% |
| Bulgarians | 99.9 /100 | #53 | Exceptional 11.7% |
| Immigrants | Uzbekistan | 99.9 /100 | #54 | Exceptional 11.7% |
| Cypriots | 99.9 /100 | #55 | Exceptional 11.7% |
| Burmese | 99.8 /100 | #56 | Exceptional 11.7% |