Immigrants from Micronesia vs Spaniard Single Male Poverty
COMPARE
Immigrants from Micronesia
Spaniard
Single Male Poverty
Single Male Poverty Comparison
Immigrants from Micronesia
Spaniards
13.5%
SINGLE MALE POVERTY
1.2/ 100
METRIC RATING
246th/ 347
METRIC RANK
13.7%
SINGLE MALE POVERTY
0.4/ 100
METRIC RATING
255th/ 347
METRIC RANK
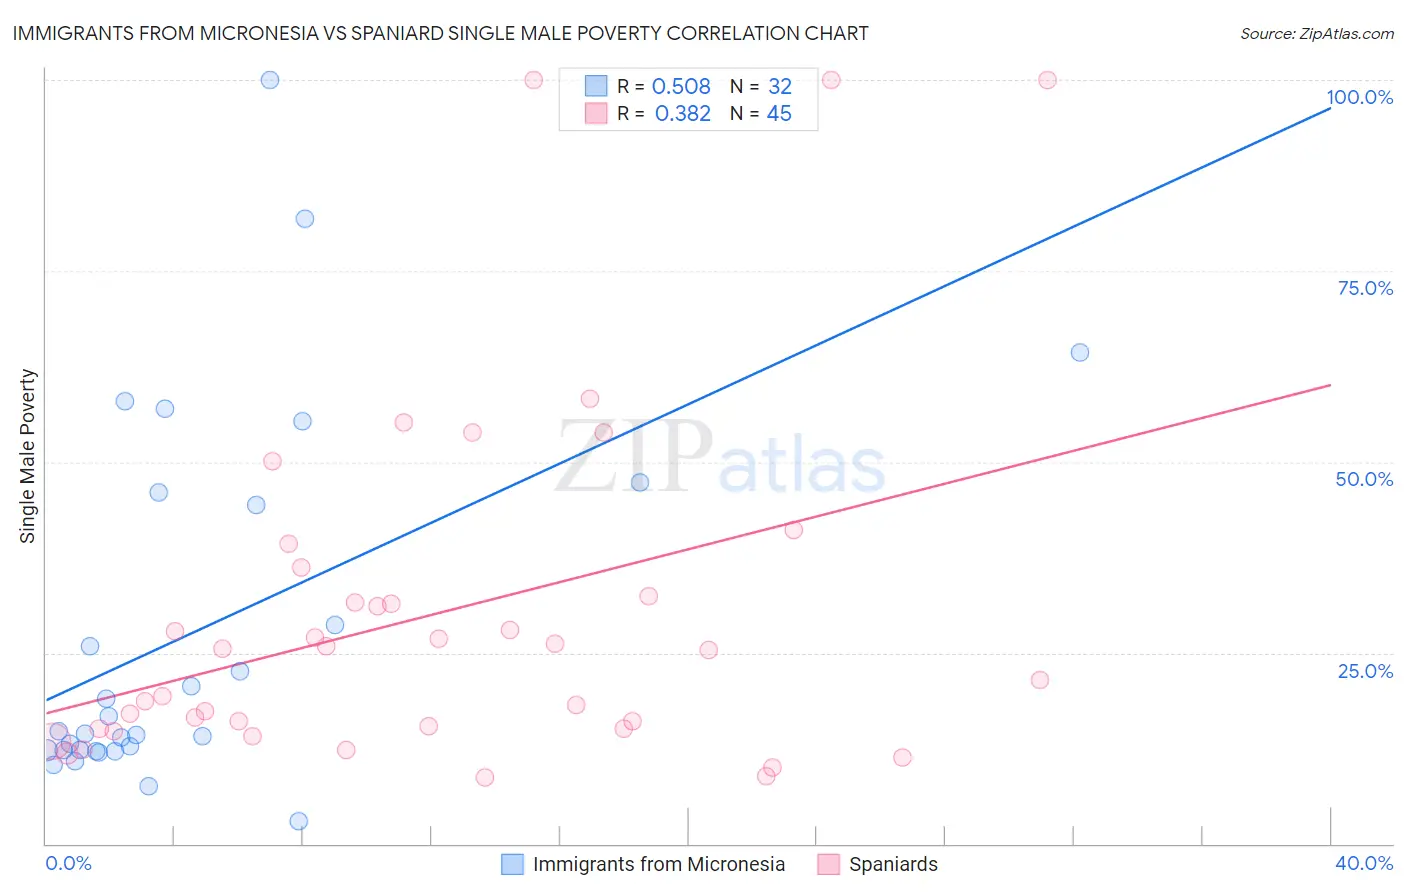
Immigrants from Micronesia vs Spaniard Single Male Poverty Correlation Chart
The statistical analysis conducted on geographies consisting of 60,290,539 people shows a substantial positive correlation between the proportion of Immigrants from Micronesia and poverty level among single males in the United States with a correlation coefficient (R) of 0.508 and weighted average of 13.5%. Similarly, the statistical analysis conducted on geographies consisting of 390,345,278 people shows a mild positive correlation between the proportion of Spaniards and poverty level among single males in the United States with a correlation coefficient (R) of 0.382 and weighted average of 13.7%, a difference of 1.3%.
Single Male Poverty Correlation Summary
| Measurement | Immigrants from Micronesia | Spaniard |
| Minimum | 3.0% | 8.7% |
| Maximum | 100.0% | 100.0% |
| Range | 97.0% | 91.3% |
| Mean | 27.8% | 30.0% |
| Median | 14.5% | 25.4% |
| Interquartile 25% (IQ1) | 12.2% | 15.0% |
| Interquartile 75% (IQ3) | 45.2% | 34.3% |
| Interquartile Range (IQR) | 32.9% | 19.3% |
| Standard Deviation (Sample) | 23.9% | 23.1% |
| Standard Deviation (Population) | 23.5% | 22.8% |
Demographics Similar to Immigrants from Micronesia and Spaniards by Single Male Poverty
In terms of single male poverty, the demographic groups most similar to Immigrants from Micronesia are Belgian (13.5%, a difference of 0.010%), Czech (13.5%, a difference of 0.040%), Immigrants from Latin America (13.5%, a difference of 0.10%), Spanish (13.6%, a difference of 0.28%), and Immigrants from Somalia (13.6%, a difference of 0.30%). Similarly, the demographic groups most similar to Spaniards are Immigrants from Belize (13.7%, a difference of 0.10%), Subsaharan African (13.7%, a difference of 0.11%), Immigrants from Central America (13.8%, a difference of 0.29%), Immigrants from Guatemala (13.8%, a difference of 0.35%), and Guatemalan (13.8%, a difference of 0.39%).
| Demographics | Rating | Rank | Single Male Poverty |
| Belizeans | 2.3 /100 | #240 | Tragic 13.4% |
| Immigrants | Germany | 2.1 /100 | #241 | Tragic 13.4% |
| Carpatho Rusyns | 2.1 /100 | #242 | Tragic 13.4% |
| Barbadians | 2.1 /100 | #243 | Tragic 13.4% |
| Immigrants | Senegal | 1.7 /100 | #244 | Tragic 13.5% |
| Immigrants | Latin America | 1.3 /100 | #245 | Tragic 13.5% |
| Immigrants | Micronesia | 1.2 /100 | #246 | Tragic 13.5% |
| Belgians | 1.2 /100 | #247 | Tragic 13.5% |
| Czechs | 1.2 /100 | #248 | Tragic 13.5% |
| Spanish | 1.0 /100 | #249 | Tragic 13.6% |
| Immigrants | Somalia | 1.0 /100 | #250 | Tragic 13.6% |
| Immigrants | Zaire | 0.9 /100 | #251 | Tragic 13.6% |
| Finns | 0.9 /100 | #252 | Tragic 13.6% |
| German Russians | 0.8 /100 | #253 | Tragic 13.6% |
| Sub-Saharan Africans | 0.5 /100 | #254 | Tragic 13.7% |
| Spaniards | 0.4 /100 | #255 | Tragic 13.7% |
| Immigrants | Belize | 0.4 /100 | #256 | Tragic 13.7% |
| Immigrants | Central America | 0.3 /100 | #257 | Tragic 13.8% |
| Immigrants | Guatemala | 0.3 /100 | #258 | Tragic 13.8% |
| Guatemalans | 0.3 /100 | #259 | Tragic 13.8% |
| Swiss | 0.3 /100 | #260 | Tragic 13.8% |