Bangladeshi vs Luxembourger Child Poverty Under the Age of 5
COMPARE
Bangladeshi
Luxembourger
Child Poverty Under the Age of 5
Child Poverty Under the Age of 5 Comparison
Bangladeshis
Luxembourgers
20.6%
CHILD POVERTY UNDER THE AGE OF 5
0.1/ 100
METRIC RATING
275th/ 347
METRIC RANK
14.9%
CHILD POVERTY UNDER THE AGE OF 5
99.4/ 100
METRIC RATING
53rd/ 347
METRIC RANK
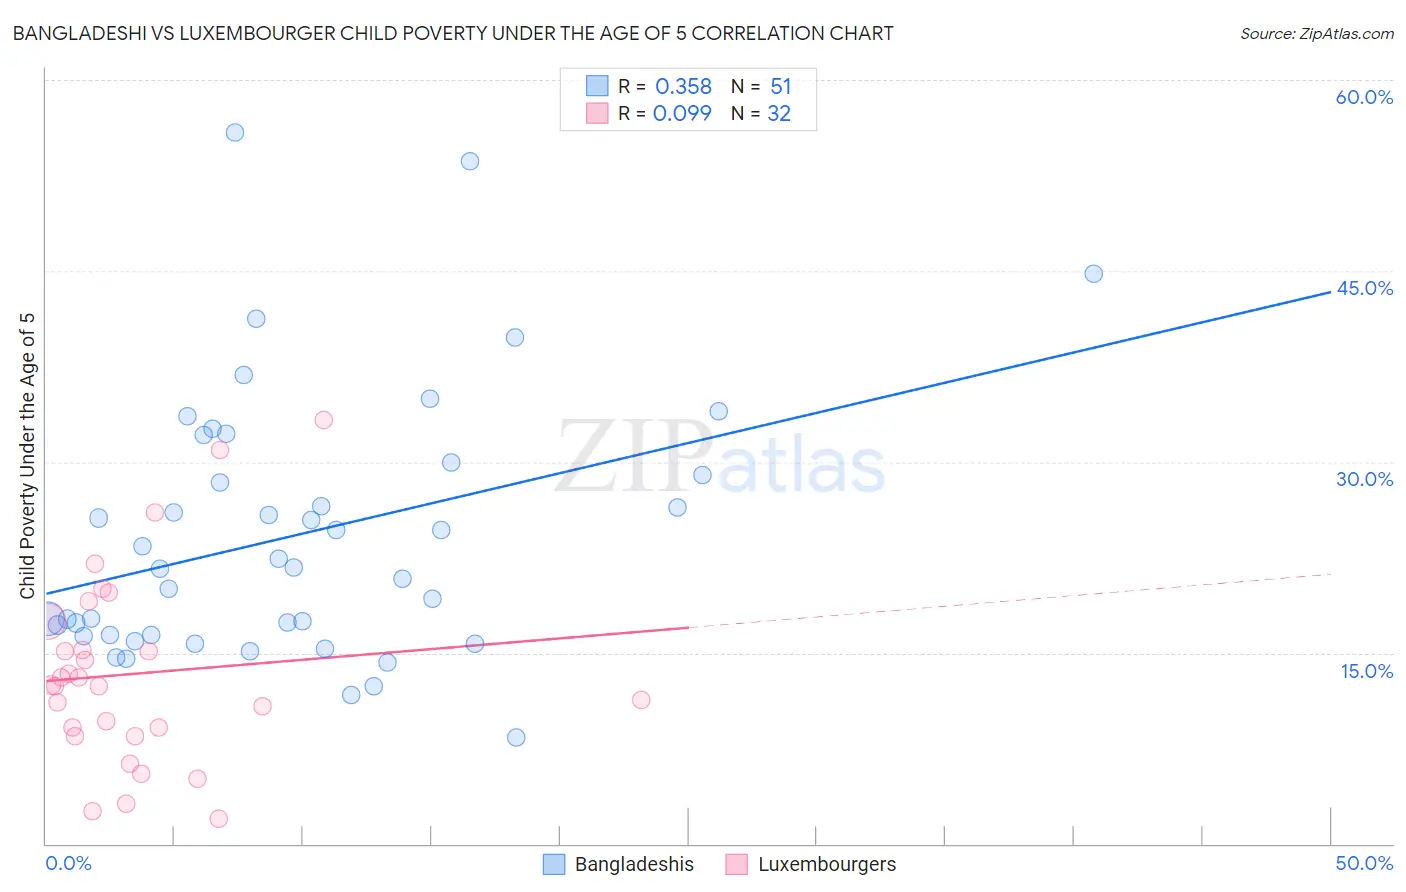
Bangladeshi vs Luxembourger Child Poverty Under the Age of 5 Correlation Chart
The statistical analysis conducted on geographies consisting of 139,356,548 people shows a mild positive correlation between the proportion of Bangladeshis and poverty level among children under the age of 5 in the United States with a correlation coefficient (R) of 0.358 and weighted average of 20.6%. Similarly, the statistical analysis conducted on geographies consisting of 141,046,176 people shows a slight positive correlation between the proportion of Luxembourgers and poverty level among children under the age of 5 in the United States with a correlation coefficient (R) of 0.099 and weighted average of 14.9%, a difference of 38.3%.
Child Poverty Under the Age of 5 Correlation Summary
| Measurement | Bangladeshi | Luxembourger |
| Minimum | 8.3% | 2.0% |
| Maximum | 55.9% | 33.3% |
| Range | 47.5% | 31.4% |
| Mean | 24.3% | 13.4% |
| Median | 21.7% | 12.5% |
| Interquartile 25% (IQ1) | 16.4% | 8.8% |
| Interquartile 75% (IQ3) | 30.0% | 16.3% |
| Interquartile Range (IQR) | 13.6% | 7.6% |
| Standard Deviation (Sample) | 10.3% | 7.5% |
| Standard Deviation (Population) | 10.2% | 7.4% |
Similar Demographics by Child Poverty Under the Age of 5
Demographics Similar to Bangladeshis by Child Poverty Under the Age of 5
In terms of child poverty under the age of 5, the demographic groups most similar to Bangladeshis are Immigrants from Belize (20.6%, a difference of 0.050%), West Indian (20.6%, a difference of 0.090%), Central American (20.6%, a difference of 0.15%), Immigrants from West Indies (20.7%, a difference of 0.26%), and Immigrants from Grenada (20.7%, a difference of 0.28%).
| Demographics | Rating | Rank | Child Poverty Under the Age of 5 |
| Belizeans | 0.1 /100 | #268 | Tragic 20.3% |
| Immigrants | Burma/Myanmar | 0.1 /100 | #269 | Tragic 20.4% |
| Jamaicans | 0.1 /100 | #270 | Tragic 20.4% |
| Americans | 0.1 /100 | #271 | Tragic 20.5% |
| Immigrants | Jamaica | 0.1 /100 | #272 | Tragic 20.5% |
| Central Americans | 0.1 /100 | #273 | Tragic 20.6% |
| Immigrants | Belize | 0.1 /100 | #274 | Tragic 20.6% |
| Bangladeshis | 0.1 /100 | #275 | Tragic 20.6% |
| West Indians | 0.0 /100 | #276 | Tragic 20.6% |
| Immigrants | West Indies | 0.0 /100 | #277 | Tragic 20.7% |
| Immigrants | Grenada | 0.0 /100 | #278 | Tragic 20.7% |
| Sub-Saharan Africans | 0.0 /100 | #279 | Tragic 20.8% |
| French American Indians | 0.0 /100 | #280 | Tragic 20.8% |
| Senegalese | 0.0 /100 | #281 | Tragic 20.9% |
| Potawatomi | 0.0 /100 | #282 | Tragic 21.0% |
Demographics Similar to Luxembourgers by Child Poverty Under the Age of 5
In terms of child poverty under the age of 5, the demographic groups most similar to Luxembourgers are Immigrants from Israel (14.9%, a difference of 0.0%), Danish (14.9%, a difference of 0.070%), Immigrants from Pakistan (14.9%, a difference of 0.14%), Immigrants from Serbia (14.9%, a difference of 0.17%), and Egyptian (14.9%, a difference of 0.22%).
| Demographics | Rating | Rank | Child Poverty Under the Age of 5 |
| Tsimshian | 99.6 /100 | #46 | Exceptional 14.7% |
| Russians | 99.6 /100 | #47 | Exceptional 14.8% |
| Immigrants | Czechoslovakia | 99.6 /100 | #48 | Exceptional 14.8% |
| Immigrants | Bulgaria | 99.6 /100 | #49 | Exceptional 14.8% |
| Immigrants | Northern Europe | 99.6 /100 | #50 | Exceptional 14.8% |
| Estonians | 99.6 /100 | #51 | Exceptional 14.8% |
| Immigrants | Serbia | 99.5 /100 | #52 | Exceptional 14.9% |
| Luxembourgers | 99.4 /100 | #53 | Exceptional 14.9% |
| Immigrants | Israel | 99.4 /100 | #54 | Exceptional 14.9% |
| Danes | 99.4 /100 | #55 | Exceptional 14.9% |
| Immigrants | Pakistan | 99.4 /100 | #56 | Exceptional 14.9% |
| Egyptians | 99.4 /100 | #57 | Exceptional 14.9% |
| Swedes | 99.4 /100 | #58 | Exceptional 15.0% |
| Paraguayans | 99.4 /100 | #59 | Exceptional 15.0% |
| Immigrants | Russia | 99.3 /100 | #60 | Exceptional 15.0% |