Immigrants from Mexico vs Palestinian Family Poverty
COMPARE
Immigrants from Mexico
Palestinian
Family Poverty
Family Poverty Comparison
Immigrants from Mexico
Palestinians
12.3%
FAMILY POVERTY
0.0/ 100
METRIC RATING
315th/ 347
METRIC RANK
8.3%
FAMILY POVERTY
91.1/ 100
METRIC RATING
123rd/ 347
METRIC RANK
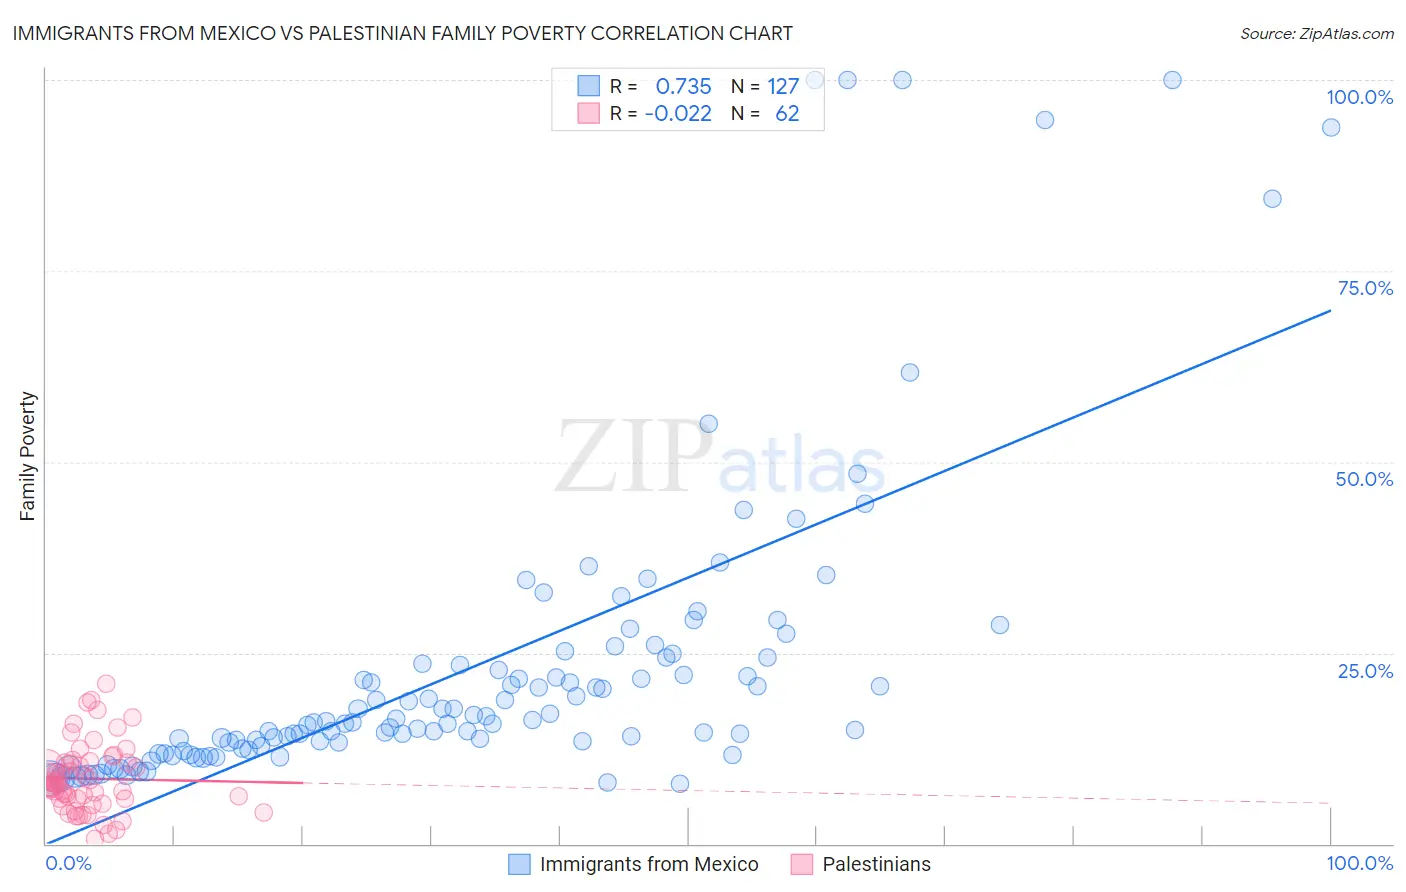
Immigrants from Mexico vs Palestinian Family Poverty Correlation Chart
The statistical analysis conducted on geographies consisting of 511,802,824 people shows a strong positive correlation between the proportion of Immigrants from Mexico and poverty level among families in the United States with a correlation coefficient (R) of 0.735 and weighted average of 12.3%. Similarly, the statistical analysis conducted on geographies consisting of 216,211,799 people shows no correlation between the proportion of Palestinians and poverty level among families in the United States with a correlation coefficient (R) of -0.022 and weighted average of 8.3%, a difference of 47.5%.
Family Poverty Correlation Summary
| Measurement | Immigrants from Mexico | Palestinian |
| Minimum | 7.9% | 0.67% |
| Maximum | 100.0% | 21.0% |
| Range | 92.1% | 20.3% |
| Mean | 23.1% | 8.5% |
| Median | 15.9% | 7.9% |
| Interquartile 25% (IQ1) | 12.5% | 5.8% |
| Interquartile 75% (IQ3) | 24.4% | 10.7% |
| Interquartile Range (IQR) | 11.9% | 4.9% |
| Standard Deviation (Sample) | 20.2% | 4.5% |
| Standard Deviation (Population) | 20.1% | 4.4% |
Similar Demographics by Family Poverty
Demographics Similar to Immigrants from Mexico by Family Poverty
In terms of family poverty, the demographic groups most similar to Immigrants from Mexico are Kiowa (12.2%, a difference of 0.26%), Honduran (12.4%, a difference of 0.74%), Immigrants from Caribbean (12.2%, a difference of 0.76%), Immigrants from Grenada (12.4%, a difference of 0.96%), and U.S. Virgin Islander (12.4%, a difference of 0.96%).
| Demographics | Rating | Rank | Family Poverty |
| Seminole | 0.0 /100 | #308 | Tragic 11.9% |
| Hispanics or Latinos | 0.0 /100 | #309 | Tragic 12.0% |
| Immigrants | Guatemala | 0.0 /100 | #310 | Tragic 12.0% |
| Ute | 0.0 /100 | #311 | Tragic 12.1% |
| Immigrants | Central America | 0.0 /100 | #312 | Tragic 12.1% |
| Immigrants | Caribbean | 0.0 /100 | #313 | Tragic 12.2% |
| Kiowa | 0.0 /100 | #314 | Tragic 12.2% |
| Immigrants | Mexico | 0.0 /100 | #315 | Tragic 12.3% |
| Hondurans | 0.0 /100 | #316 | Tragic 12.4% |
| Immigrants | Grenada | 0.0 /100 | #317 | Tragic 12.4% |
| U.S. Virgin Islanders | 0.0 /100 | #318 | Tragic 12.4% |
| British West Indians | 0.0 /100 | #319 | Tragic 12.4% |
| Inupiat | 0.0 /100 | #320 | Tragic 12.5% |
| Arapaho | 0.0 /100 | #321 | Tragic 12.7% |
| Immigrants | Honduras | 0.0 /100 | #322 | Tragic 12.7% |
Demographics Similar to Palestinians by Family Poverty
In terms of family poverty, the demographic groups most similar to Palestinians are Paraguayan (8.3%, a difference of 0.070%), Native Hawaiian (8.3%, a difference of 0.080%), Soviet Union (8.3%, a difference of 0.10%), Pakistani (8.3%, a difference of 0.14%), and Immigrants from Egypt (8.3%, a difference of 0.25%).
| Demographics | Rating | Rank | Family Poverty |
| South Africans | 93.4 /100 | #116 | Exceptional 8.2% |
| Immigrants | Russia | 93.2 /100 | #117 | Exceptional 8.2% |
| Immigrants | Western Europe | 92.9 /100 | #118 | Exceptional 8.2% |
| French | 92.8 /100 | #119 | Exceptional 8.3% |
| Immigrants | Egypt | 91.6 /100 | #120 | Exceptional 8.3% |
| Native Hawaiians | 91.3 /100 | #121 | Exceptional 8.3% |
| Paraguayans | 91.2 /100 | #122 | Exceptional 8.3% |
| Palestinians | 91.1 /100 | #123 | Exceptional 8.3% |
| Soviet Union | 90.8 /100 | #124 | Exceptional 8.3% |
| Pakistanis | 90.8 /100 | #125 | Exceptional 8.3% |
| Icelanders | 90.3 /100 | #126 | Exceptional 8.3% |
| Immigrants | Hungary | 89.9 /100 | #127 | Excellent 8.4% |
| Argentineans | 89.6 /100 | #128 | Excellent 8.4% |
| Portuguese | 89.2 /100 | #129 | Excellent 8.4% |
| Immigrants | Bosnia and Herzegovina | 88.6 /100 | #130 | Excellent 8.4% |