Immigrants from Mexico vs Somali Associate's Degree
COMPARE
Immigrants from Mexico
Somali
Associate's Degree
Associate's Degree Comparison
Immigrants from Mexico
Somalis
33.7%
ASSOCIATE'S DEGREE
0.0/ 100
METRIC RATING
339th/ 347
METRIC RANK
46.8%
ASSOCIATE'S DEGREE
62.5/ 100
METRIC RATING
163rd/ 347
METRIC RANK
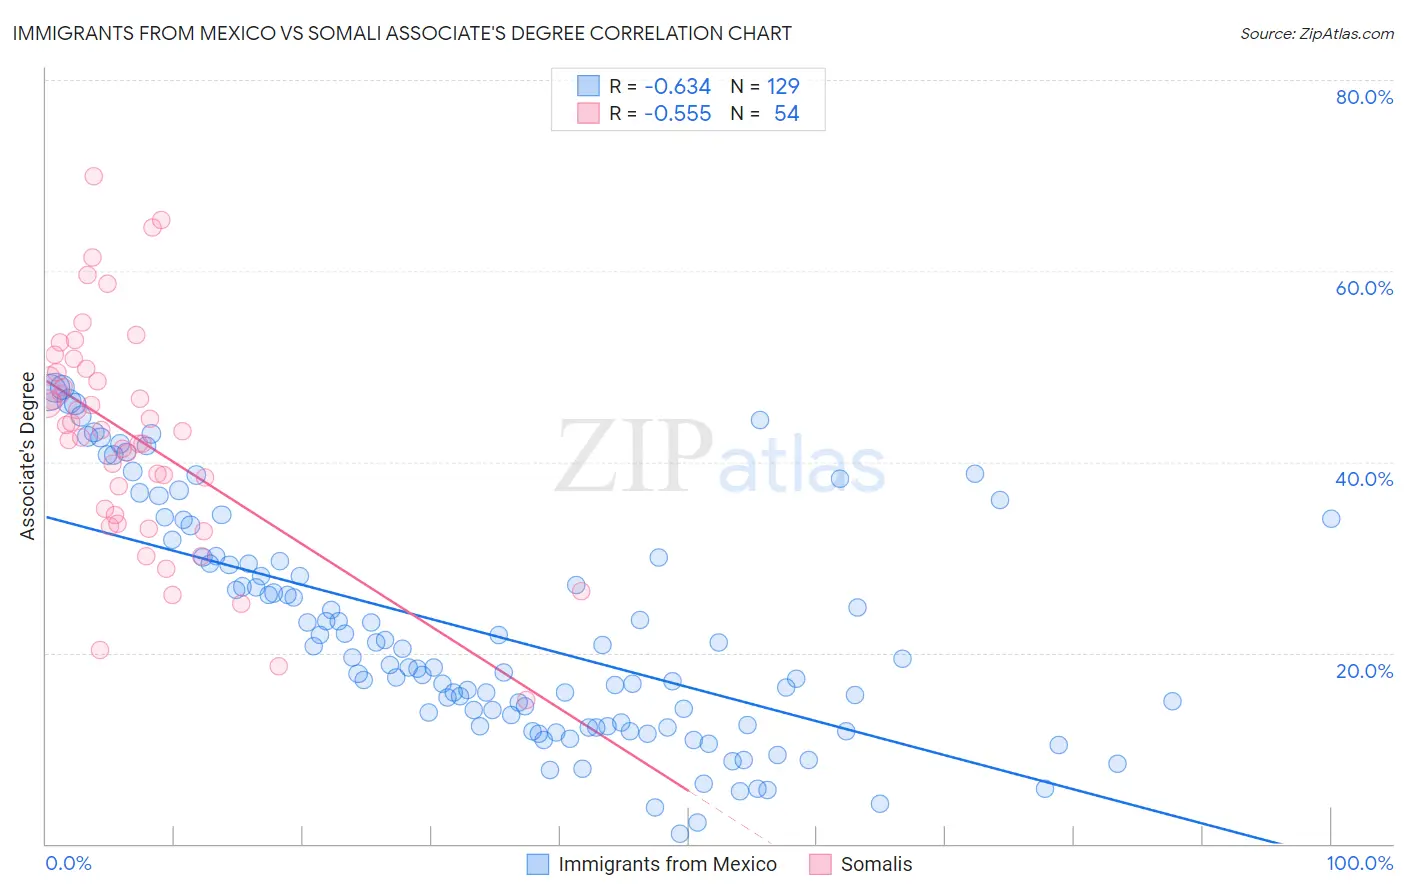
Immigrants from Mexico vs Somali Associate's Degree Correlation Chart
The statistical analysis conducted on geographies consisting of 513,696,762 people shows a significant negative correlation between the proportion of Immigrants from Mexico and percentage of population with at least associate's degree education in the United States with a correlation coefficient (R) of -0.634 and weighted average of 33.7%. Similarly, the statistical analysis conducted on geographies consisting of 99,330,256 people shows a substantial negative correlation between the proportion of Somalis and percentage of population with at least associate's degree education in the United States with a correlation coefficient (R) of -0.555 and weighted average of 46.8%, a difference of 38.7%.
Associate's Degree Correlation Summary
| Measurement | Immigrants from Mexico | Somali |
| Minimum | 0.99% | 15.0% |
| Maximum | 47.9% | 69.9% |
| Range | 46.9% | 54.9% |
| Mean | 22.3% | 42.6% |
| Median | 19.4% | 43.3% |
| Interquartile 25% (IQ1) | 12.4% | 34.4% |
| Interquartile 75% (IQ3) | 30.0% | 49.4% |
| Interquartile Range (IQR) | 17.6% | 15.0% |
| Standard Deviation (Sample) | 12.0% | 11.7% |
| Standard Deviation (Population) | 11.9% | 11.6% |
Similar Demographics by Associate's Degree
Demographics Similar to Immigrants from Mexico by Associate's Degree
In terms of associate's degree, the demographic groups most similar to Immigrants from Mexico are Pueblo (34.0%, a difference of 0.71%), Lumbee (34.1%, a difference of 1.1%), Hopi (34.6%, a difference of 2.4%), Spanish American Indian (34.9%, a difference of 3.3%), and Native/Alaskan (34.9%, a difference of 3.5%).
| Demographics | Rating | Rank | Associate's Degree |
| Immigrants | Central America | 0.0 /100 | #332 | Tragic 35.0% |
| Mexicans | 0.0 /100 | #333 | Tragic 35.0% |
| Natives/Alaskans | 0.0 /100 | #334 | Tragic 34.9% |
| Spanish American Indians | 0.0 /100 | #335 | Tragic 34.9% |
| Hopi | 0.0 /100 | #336 | Tragic 34.6% |
| Lumbee | 0.0 /100 | #337 | Tragic 34.1% |
| Pueblo | 0.0 /100 | #338 | Tragic 34.0% |
| Immigrants | Mexico | 0.0 /100 | #339 | Tragic 33.7% |
| Navajo | 0.0 /100 | #340 | Tragic 32.6% |
| Inupiat | 0.0 /100 | #341 | Tragic 32.6% |
| Yakama | 0.0 /100 | #342 | Tragic 32.3% |
| Tohono O'odham | 0.0 /100 | #343 | Tragic 31.8% |
| Yuman | 0.0 /100 | #344 | Tragic 31.3% |
| Pima | 0.0 /100 | #345 | Tragic 30.2% |
| Houma | 0.0 /100 | #346 | Tragic 28.2% |
Demographics Similar to Somalis by Associate's Degree
In terms of associate's degree, the demographic groups most similar to Somalis are Colombian (46.8%, a difference of 0.010%), Immigrants from Africa (46.8%, a difference of 0.060%), Immigrants from South America (46.7%, a difference of 0.21%), Scandinavian (46.9%, a difference of 0.22%), and Scottish (46.9%, a difference of 0.23%).
| Demographics | Rating | Rank | Associate's Degree |
| South Americans | 70.5 /100 | #156 | Good 47.1% |
| Sudanese | 70.3 /100 | #157 | Good 47.1% |
| Immigrants | Germany | 69.7 /100 | #158 | Good 47.1% |
| Immigrants | Poland | 69.2 /100 | #159 | Good 47.1% |
| Scottish | 65.4 /100 | #160 | Good 46.9% |
| Scandinavians | 65.2 /100 | #161 | Good 46.9% |
| Immigrants | Africa | 63.2 /100 | #162 | Good 46.8% |
| Somalis | 62.5 /100 | #163 | Good 46.8% |
| Colombians | 62.4 /100 | #164 | Good 46.8% |
| Immigrants | South America | 59.9 /100 | #165 | Average 46.7% |
| Hungarians | 59.3 /100 | #166 | Average 46.7% |
| Immigrants | Sierra Leone | 59.2 /100 | #167 | Average 46.7% |
| Immigrants | Somalia | 55.5 /100 | #168 | Average 46.5% |
| Uruguayans | 55.4 /100 | #169 | Average 46.5% |
| Irish | 53.6 /100 | #170 | Average 46.5% |