Immigrants from Mexico vs English Child Poverty Under the Age of 5
COMPARE
Immigrants from Mexico
English
Child Poverty Under the Age of 5
Child Poverty Under the Age of 5 Comparison
Immigrants from Mexico
English
22.2%
CHILD POVERTY UNDER THE AGE OF 5
0.0/ 100
METRIC RATING
305th/ 347
METRIC RANK
16.8%
CHILD POVERTY UNDER THE AGE OF 5
70.4/ 100
METRIC RATING
161st/ 347
METRIC RANK
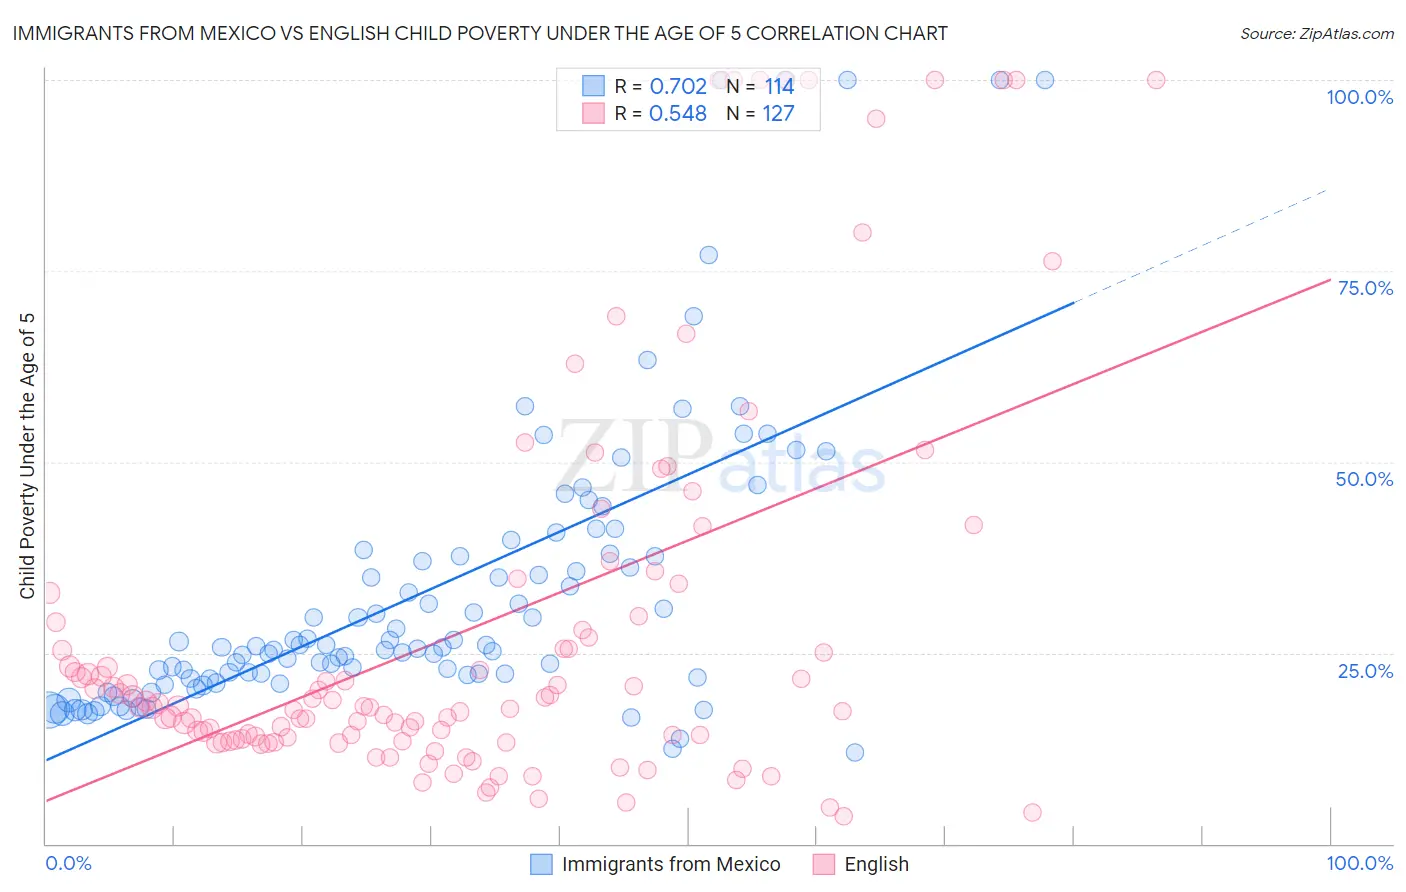
Immigrants from Mexico vs English Child Poverty Under the Age of 5 Correlation Chart
The statistical analysis conducted on geographies consisting of 489,190,038 people shows a strong positive correlation between the proportion of Immigrants from Mexico and poverty level among children under the age of 5 in the United States with a correlation coefficient (R) of 0.702 and weighted average of 22.2%. Similarly, the statistical analysis conducted on geographies consisting of 535,899,350 people shows a substantial positive correlation between the proportion of English and poverty level among children under the age of 5 in the United States with a correlation coefficient (R) of 0.548 and weighted average of 16.8%, a difference of 32.0%.
Child Poverty Under the Age of 5 Correlation Summary
| Measurement | Immigrants from Mexico | English |
| Minimum | 11.9% | 3.5% |
| Maximum | 100.0% | 100.0% |
| Range | 88.1% | 96.5% |
| Mean | 32.8% | 28.1% |
| Median | 25.8% | 18.0% |
| Interquartile 25% (IQ1) | 21.7% | 13.6% |
| Interquartile 75% (IQ3) | 37.6% | 29.0% |
| Interquartile Range (IQR) | 16.0% | 15.4% |
| Standard Deviation (Sample) | 19.1% | 25.5% |
| Standard Deviation (Population) | 19.0% | 25.4% |
Similar Demographics by Child Poverty Under the Age of 5
Demographics Similar to Immigrants from Mexico by Child Poverty Under the Age of 5
In terms of child poverty under the age of 5, the demographic groups most similar to Immigrants from Mexico are Indonesian (22.3%, a difference of 0.060%), Immigrants from Guatemala (22.0%, a difference of 0.87%), Inupiat (22.0%, a difference of 0.98%), Iroquois (22.0%, a difference of 1.1%), and Immigrants from Central America (22.0%, a difference of 1.2%).
| Demographics | Rating | Rank | Child Poverty Under the Age of 5 |
| Blackfeet | 0.0 /100 | #298 | Tragic 21.8% |
| Chickasaw | 0.0 /100 | #299 | Tragic 21.8% |
| Alaskan Athabascans | 0.0 /100 | #300 | Tragic 21.8% |
| Immigrants | Central America | 0.0 /100 | #301 | Tragic 22.0% |
| Iroquois | 0.0 /100 | #302 | Tragic 22.0% |
| Inupiat | 0.0 /100 | #303 | Tragic 22.0% |
| Immigrants | Guatemala | 0.0 /100 | #304 | Tragic 22.0% |
| Immigrants | Mexico | 0.0 /100 | #305 | Tragic 22.2% |
| Indonesians | 0.0 /100 | #306 | Tragic 22.3% |
| Immigrants | Bahamas | 0.0 /100 | #307 | Tragic 22.7% |
| Immigrants | Dominica | 0.0 /100 | #308 | Tragic 22.7% |
| Houma | 0.0 /100 | #309 | Tragic 22.7% |
| Africans | 0.0 /100 | #310 | Tragic 22.8% |
| Seminole | 0.0 /100 | #311 | Tragic 22.8% |
| Hondurans | 0.0 /100 | #312 | Tragic 23.0% |
Demographics Similar to English by Child Poverty Under the Age of 5
In terms of child poverty under the age of 5, the demographic groups most similar to English are Costa Rican (16.9%, a difference of 0.060%), Scottish (16.9%, a difference of 0.21%), Irish (16.8%, a difference of 0.22%), Immigrants from Syria (16.8%, a difference of 0.25%), and Czechoslovakian (16.8%, a difference of 0.28%).
| Demographics | Rating | Rank | Child Poverty Under the Age of 5 |
| Immigrants | Venezuela | 76.0 /100 | #154 | Good 16.7% |
| South Americans | 75.1 /100 | #155 | Good 16.7% |
| Afghans | 74.4 /100 | #156 | Good 16.8% |
| Venezuelans | 73.7 /100 | #157 | Good 16.8% |
| Czechoslovakians | 72.5 /100 | #158 | Good 16.8% |
| Immigrants | Syria | 72.3 /100 | #159 | Good 16.8% |
| Irish | 72.0 /100 | #160 | Good 16.8% |
| English | 70.4 /100 | #161 | Good 16.8% |
| Costa Ricans | 69.8 /100 | #162 | Good 16.9% |
| Scottish | 68.6 /100 | #163 | Good 16.9% |
| Immigrants | Oceania | 67.6 /100 | #164 | Good 16.9% |
| Immigrants | Colombia | 66.9 /100 | #165 | Good 16.9% |
| Slavs | 64.0 /100 | #166 | Good 17.0% |
| Immigrants | Uzbekistan | 62.0 /100 | #167 | Good 17.0% |
| Uruguayans | 60.5 /100 | #168 | Good 17.0% |