Immigrants from Mexico vs Liberian Child Poverty Under the Age of 5
COMPARE
Immigrants from Mexico
Liberian
Child Poverty Under the Age of 5
Child Poverty Under the Age of 5 Comparison
Immigrants from Mexico
Liberians
22.2%
CHILD POVERTY UNDER THE AGE OF 5
0.0/ 100
METRIC RATING
305th/ 347
METRIC RANK
20.2%
CHILD POVERTY UNDER THE AGE OF 5
0.1/ 100
METRIC RATING
262nd/ 347
METRIC RANK
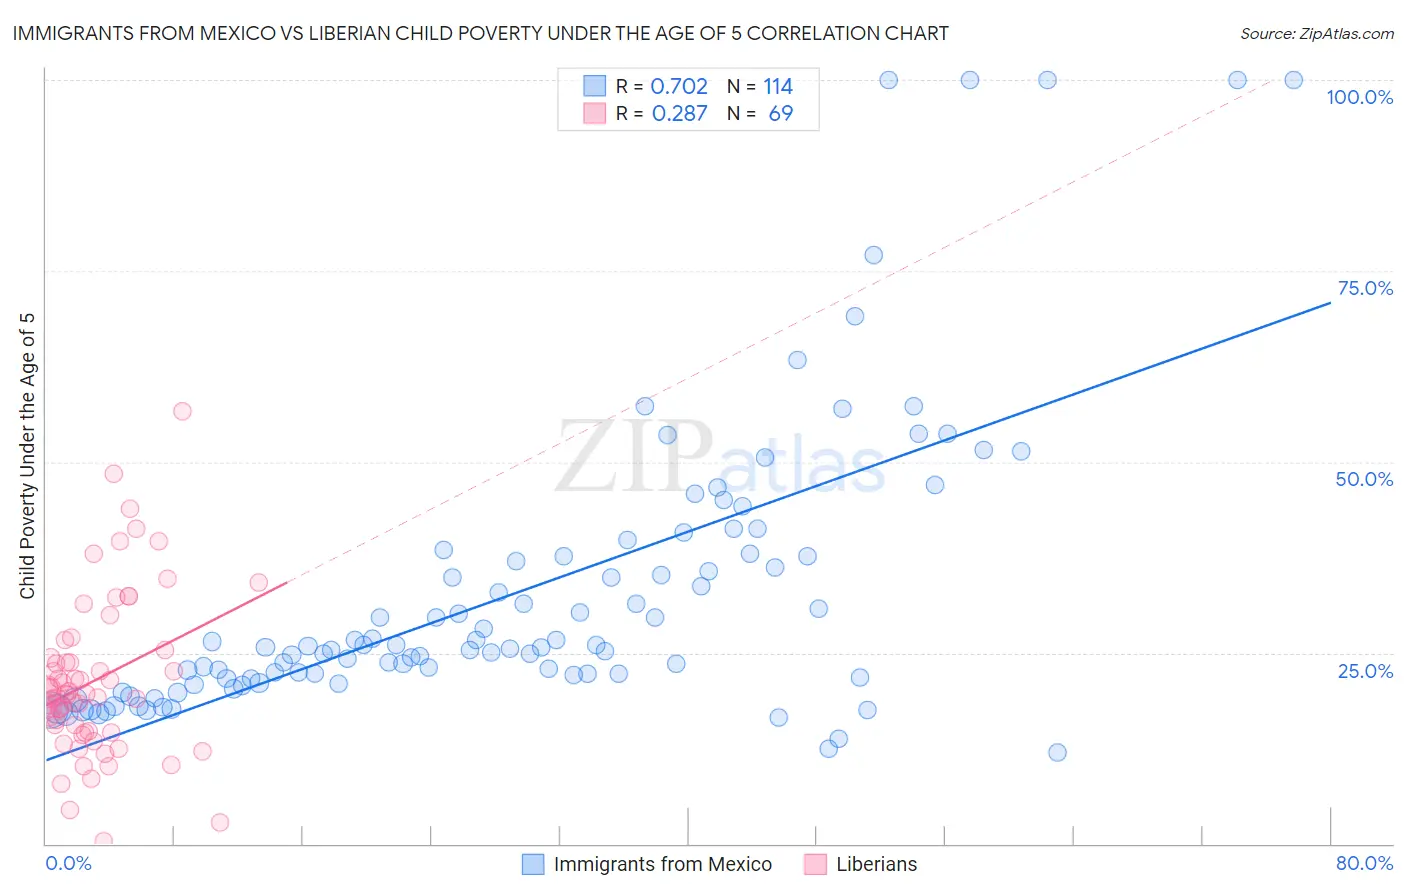
Immigrants from Mexico vs Liberian Child Poverty Under the Age of 5 Correlation Chart
The statistical analysis conducted on geographies consisting of 489,190,038 people shows a strong positive correlation between the proportion of Immigrants from Mexico and poverty level among children under the age of 5 in the United States with a correlation coefficient (R) of 0.702 and weighted average of 22.2%. Similarly, the statistical analysis conducted on geographies consisting of 116,697,175 people shows a weak positive correlation between the proportion of Liberians and poverty level among children under the age of 5 in the United States with a correlation coefficient (R) of 0.287 and weighted average of 20.2%, a difference of 10.2%.
Child Poverty Under the Age of 5 Correlation Summary
| Measurement | Immigrants from Mexico | Liberian |
| Minimum | 11.9% | 0.41% |
| Maximum | 100.0% | 56.7% |
| Range | 88.1% | 56.3% |
| Mean | 32.8% | 21.4% |
| Median | 25.8% | 19.7% |
| Interquartile 25% (IQ1) | 21.7% | 14.7% |
| Interquartile 75% (IQ3) | 37.6% | 24.9% |
| Interquartile Range (IQR) | 16.0% | 10.2% |
| Standard Deviation (Sample) | 19.1% | 10.5% |
| Standard Deviation (Population) | 19.0% | 10.4% |
Similar Demographics by Child Poverty Under the Age of 5
Demographics Similar to Immigrants from Mexico by Child Poverty Under the Age of 5
In terms of child poverty under the age of 5, the demographic groups most similar to Immigrants from Mexico are Indonesian (22.3%, a difference of 0.060%), Immigrants from Guatemala (22.0%, a difference of 0.87%), Inupiat (22.0%, a difference of 0.98%), Iroquois (22.0%, a difference of 1.1%), and Immigrants from Central America (22.0%, a difference of 1.2%).
| Demographics | Rating | Rank | Child Poverty Under the Age of 5 |
| Blackfeet | 0.0 /100 | #298 | Tragic 21.8% |
| Chickasaw | 0.0 /100 | #299 | Tragic 21.8% |
| Alaskan Athabascans | 0.0 /100 | #300 | Tragic 21.8% |
| Immigrants | Central America | 0.0 /100 | #301 | Tragic 22.0% |
| Iroquois | 0.0 /100 | #302 | Tragic 22.0% |
| Inupiat | 0.0 /100 | #303 | Tragic 22.0% |
| Immigrants | Guatemala | 0.0 /100 | #304 | Tragic 22.0% |
| Immigrants | Mexico | 0.0 /100 | #305 | Tragic 22.2% |
| Indonesians | 0.0 /100 | #306 | Tragic 22.3% |
| Immigrants | Bahamas | 0.0 /100 | #307 | Tragic 22.7% |
| Immigrants | Dominica | 0.0 /100 | #308 | Tragic 22.7% |
| Houma | 0.0 /100 | #309 | Tragic 22.7% |
| Africans | 0.0 /100 | #310 | Tragic 22.8% |
| Seminole | 0.0 /100 | #311 | Tragic 22.8% |
| Hondurans | 0.0 /100 | #312 | Tragic 23.0% |
Demographics Similar to Liberians by Child Poverty Under the Age of 5
In terms of child poverty under the age of 5, the demographic groups most similar to Liberians are Barbadian (20.2%, a difference of 0.070%), Immigrants from Liberia (20.2%, a difference of 0.19%), Spanish American Indian (20.2%, a difference of 0.31%), Immigrants from Bangladesh (20.1%, a difference of 0.41%), and Aleut (20.3%, a difference of 0.43%).
| Demographics | Rating | Rank | Child Poverty Under the Age of 5 |
| Immigrants | Cuba | 0.2 /100 | #255 | Tragic 19.9% |
| Immigrants | Barbados | 0.2 /100 | #256 | Tragic 20.0% |
| Shoshone | 0.2 /100 | #257 | Tragic 20.0% |
| Immigrants | St. Vincent and the Grenadines | 0.2 /100 | #258 | Tragic 20.0% |
| Immigrants | El Salvador | 0.2 /100 | #259 | Tragic 20.0% |
| Spanish Americans | 0.2 /100 | #260 | Tragic 20.1% |
| Immigrants | Bangladesh | 0.2 /100 | #261 | Tragic 20.1% |
| Liberians | 0.1 /100 | #262 | Tragic 20.2% |
| Barbadians | 0.1 /100 | #263 | Tragic 20.2% |
| Immigrants | Liberia | 0.1 /100 | #264 | Tragic 20.2% |
| Spanish American Indians | 0.1 /100 | #265 | Tragic 20.2% |
| Aleuts | 0.1 /100 | #266 | Tragic 20.3% |
| Ottawa | 0.1 /100 | #267 | Tragic 20.3% |
| Belizeans | 0.1 /100 | #268 | Tragic 20.3% |
| Immigrants | Burma/Myanmar | 0.1 /100 | #269 | Tragic 20.4% |