Immigrants from Mexico vs Immigrants from Burma/Myanmar College, 1 year or more
COMPARE
Immigrants from Mexico
Immigrants from Burma/Myanmar
College, 1 year or more
College, 1 year or more Comparison
Immigrants from Mexico
Immigrants from Burma/Myanmar
47.5%
COLLEGE, 1 YEAR OR MORE
0.0/ 100
METRIC RATING
341st/ 347
METRIC RANK
56.6%
COLLEGE, 1 YEAR OR MORE
2.7/ 100
METRIC RATING
231st/ 347
METRIC RANK
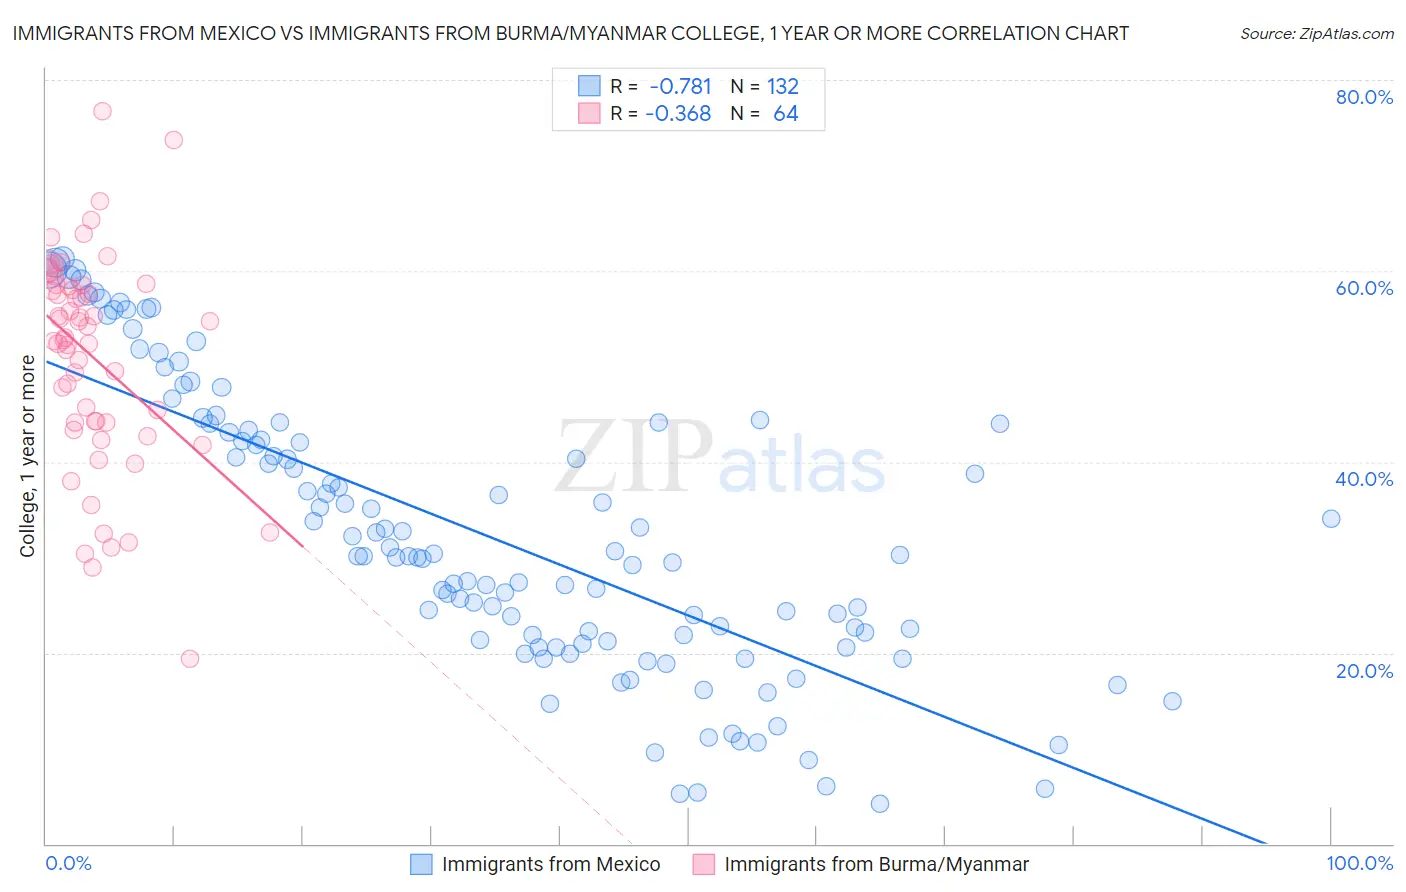
Immigrants from Mexico vs Immigrants from Burma/Myanmar College, 1 year or more Correlation Chart
The statistical analysis conducted on geographies consisting of 513,754,455 people shows a strong negative correlation between the proportion of Immigrants from Mexico and percentage of population with at least college, 1 year or more education in the United States with a correlation coefficient (R) of -0.781 and weighted average of 47.5%. Similarly, the statistical analysis conducted on geographies consisting of 172,357,706 people shows a mild negative correlation between the proportion of Immigrants from Burma/Myanmar and percentage of population with at least college, 1 year or more education in the United States with a correlation coefficient (R) of -0.368 and weighted average of 56.6%, a difference of 19.1%.
College, 1 year or more Correlation Summary
| Measurement | Immigrants from Mexico | Immigrants from Burma/Myanmar |
| Minimum | 4.2% | 19.4% |
| Maximum | 61.3% | 76.7% |
| Range | 57.1% | 57.3% |
| Mean | 32.2% | 51.0% |
| Median | 30.2% | 52.9% |
| Interquartile 25% (IQ1) | 21.3% | 44.1% |
| Interquartile 75% (IQ3) | 43.2% | 58.4% |
| Interquartile Range (IQR) | 21.9% | 14.3% |
| Standard Deviation (Sample) | 14.7% | 11.1% |
| Standard Deviation (Population) | 14.7% | 11.1% |
Similar Demographics by College, 1 year or more
Demographics Similar to Immigrants from Mexico by College, 1 year or more
In terms of college, 1 year or more, the demographic groups most similar to Immigrants from Mexico are Inupiat (47.2%, a difference of 0.57%), Tohono O'odham (47.1%, a difference of 0.79%), Immigrants from Cabo Verde (48.1%, a difference of 1.2%), Immigrants from the Azores (48.4%, a difference of 1.8%), and Immigrants from Central America (48.5%, a difference of 2.0%).
| Demographics | Rating | Rank | College, 1 year or more |
| Immigrants | Dominican Republic | 0.0 /100 | #333 | Tragic 49.1% |
| Lumbee | 0.0 /100 | #334 | Tragic 48.9% |
| Yuman | 0.0 /100 | #335 | Tragic 48.7% |
| Spanish American Indians | 0.0 /100 | #336 | Tragic 48.5% |
| Pennsylvania Germans | 0.0 /100 | #337 | Tragic 48.5% |
| Immigrants | Central America | 0.0 /100 | #338 | Tragic 48.5% |
| Immigrants | Azores | 0.0 /100 | #339 | Tragic 48.4% |
| Immigrants | Cabo Verde | 0.0 /100 | #340 | Tragic 48.1% |
| Immigrants | Mexico | 0.0 /100 | #341 | Tragic 47.5% |
| Inupiat | 0.0 /100 | #342 | Tragic 47.2% |
| Tohono O'odham | 0.0 /100 | #343 | Tragic 47.1% |
| Yakama | 0.0 /100 | #344 | Tragic 46.2% |
| Pima | 0.0 /100 | #345 | Tragic 45.6% |
| Houma | 0.0 /100 | #346 | Tragic 41.2% |
| Yup'ik | 0.0 /100 | #347 | Tragic 39.4% |
Demographics Similar to Immigrants from Burma/Myanmar by College, 1 year or more
In terms of college, 1 year or more, the demographic groups most similar to Immigrants from Burma/Myanmar are Immigrants from Bangladesh (56.6%, a difference of 0.060%), Nonimmigrants (56.5%, a difference of 0.15%), Liberian (56.7%, a difference of 0.19%), Cree (56.8%, a difference of 0.41%), and Immigrants from Fiji (56.9%, a difference of 0.54%).
| Demographics | Rating | Rank | College, 1 year or more |
| Hmong | 5.4 /100 | #224 | Tragic 57.2% |
| Vietnamese | 4.7 /100 | #225 | Tragic 57.0% |
| Immigrants | Western Africa | 4.6 /100 | #226 | Tragic 57.0% |
| Immigrants | Immigrants | 4.4 /100 | #227 | Tragic 57.0% |
| Immigrants | Fiji | 4.0 /100 | #228 | Tragic 56.9% |
| Cree | 3.6 /100 | #229 | Tragic 56.8% |
| Liberians | 3.1 /100 | #230 | Tragic 56.7% |
| Immigrants | Burma/Myanmar | 2.7 /100 | #231 | Tragic 56.6% |
| Immigrants | Bangladesh | 2.6 /100 | #232 | Tragic 56.6% |
| Immigrants | Nonimmigrants | 2.5 /100 | #233 | Tragic 56.5% |
| Spanish Americans | 1.8 /100 | #234 | Tragic 56.3% |
| West Indians | 1.8 /100 | #235 | Tragic 56.3% |
| Iroquois | 1.7 /100 | #236 | Tragic 56.2% |
| Samoans | 1.6 /100 | #237 | Tragic 56.2% |
| Barbadians | 1.3 /100 | #238 | Tragic 56.0% |