Immigrants from Malaysia vs Pima Single Mother Poverty
COMPARE
Immigrants from Malaysia
Pima
Single Mother Poverty
Single Mother Poverty Comparison
Immigrants from Malaysia
Pima
27.3%
SINGLE MOTHER POVERTY
99.5/ 100
METRIC RATING
62nd/ 347
METRIC RANK
38.6%
SINGLE MOTHER POVERTY
0.0/ 100
METRIC RATING
338th/ 347
METRIC RANK
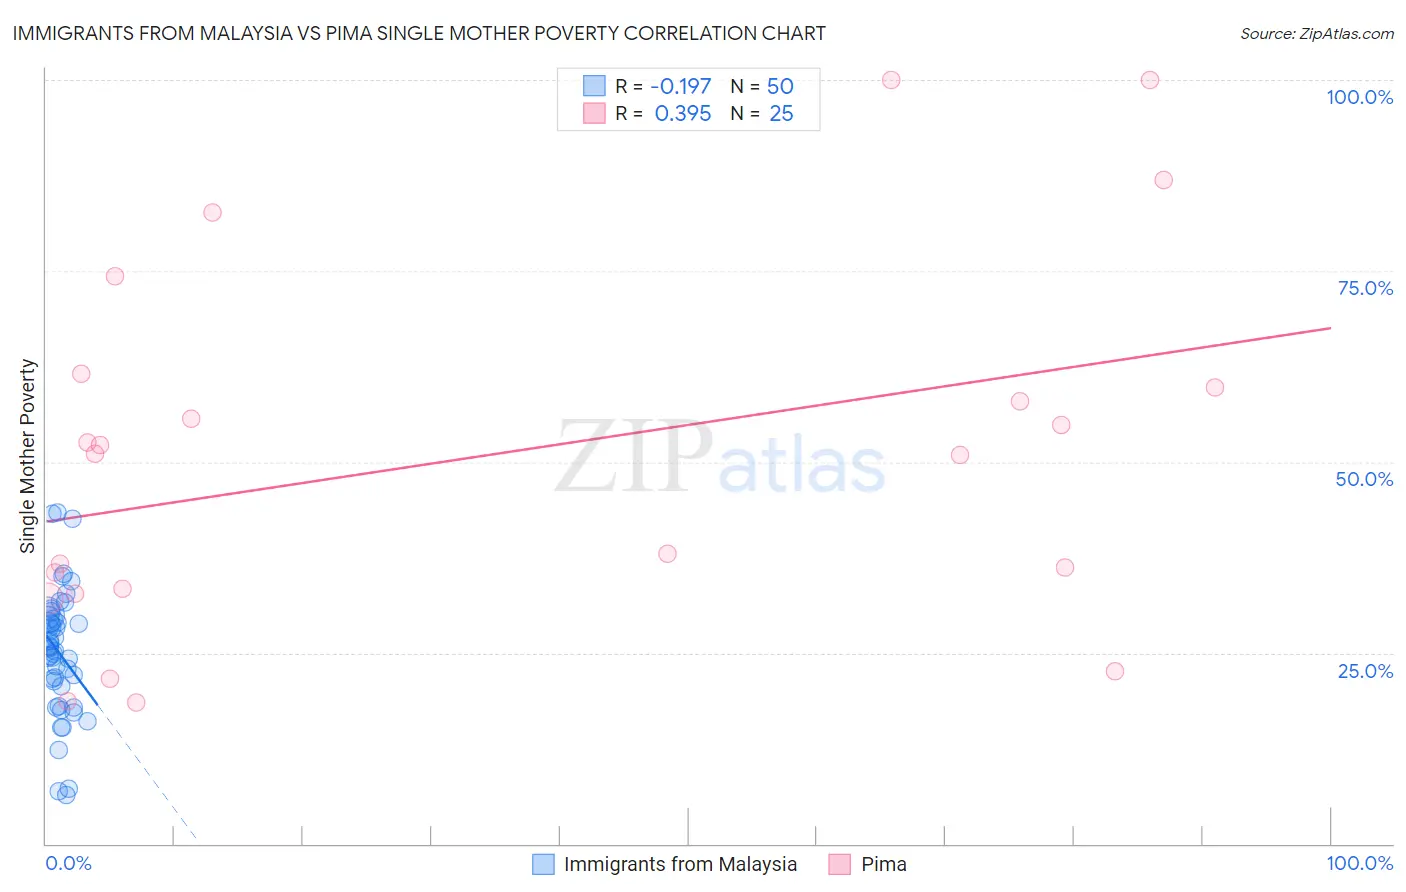
Immigrants from Malaysia vs Pima Single Mother Poverty Correlation Chart
The statistical analysis conducted on geographies consisting of 194,970,165 people shows a poor negative correlation between the proportion of Immigrants from Malaysia and poverty level among single mothers in the United States with a correlation coefficient (R) of -0.197 and weighted average of 27.3%. Similarly, the statistical analysis conducted on geographies consisting of 61,247,858 people shows a mild positive correlation between the proportion of Pima and poverty level among single mothers in the United States with a correlation coefficient (R) of 0.395 and weighted average of 38.6%, a difference of 41.4%.
Single Mother Poverty Correlation Summary
| Measurement | Immigrants from Malaysia | Pima |
| Minimum | 6.4% | 18.5% |
| Maximum | 43.4% | 100.0% |
| Range | 37.0% | 81.5% |
| Mean | 25.0% | 50.6% |
| Median | 25.4% | 51.0% |
| Interquartile 25% (IQ1) | 20.7% | 33.1% |
| Interquartile 75% (IQ3) | 29.6% | 60.6% |
| Interquartile Range (IQR) | 9.0% | 27.5% |
| Standard Deviation (Sample) | 8.3% | 23.7% |
| Standard Deviation (Population) | 8.3% | 23.3% |
Similar Demographics by Single Mother Poverty
Demographics Similar to Immigrants from Malaysia by Single Mother Poverty
In terms of single mother poverty, the demographic groups most similar to Immigrants from Malaysia are Immigrants from Northern Europe (27.3%, a difference of 0.050%), Russian (27.3%, a difference of 0.080%), Immigrants from Eastern Europe (27.2%, a difference of 0.14%), Immigrants from Turkey (27.3%, a difference of 0.16%), and Soviet Union (27.3%, a difference of 0.19%).
| Demographics | Rating | Rank | Single Mother Poverty |
| Immigrants | Egypt | 99.7 /100 | #55 | Exceptional 27.1% |
| Immigrants | Romania | 99.7 /100 | #56 | Exceptional 27.2% |
| Palestinians | 99.7 /100 | #57 | Exceptional 27.2% |
| Argentineans | 99.6 /100 | #58 | Exceptional 27.2% |
| Paraguayans | 99.6 /100 | #59 | Exceptional 27.2% |
| Eastern Europeans | 99.6 /100 | #60 | Exceptional 27.2% |
| Immigrants | Eastern Europe | 99.6 /100 | #61 | Exceptional 27.2% |
| Immigrants | Malaysia | 99.5 /100 | #62 | Exceptional 27.3% |
| Immigrants | Northern Europe | 99.5 /100 | #63 | Exceptional 27.3% |
| Russians | 99.5 /100 | #64 | Exceptional 27.3% |
| Immigrants | Turkey | 99.5 /100 | #65 | Exceptional 27.3% |
| Soviet Union | 99.5 /100 | #66 | Exceptional 27.3% |
| Immigrants | Australia | 99.5 /100 | #67 | Exceptional 27.3% |
| Immigrants | Czechoslovakia | 99.5 /100 | #68 | Exceptional 27.4% |
| Lithuanians | 99.4 /100 | #69 | Exceptional 27.4% |
Demographics Similar to Pima by Single Mother Poverty
In terms of single mother poverty, the demographic groups most similar to Pima are Crow (38.6%, a difference of 0.090%), Immigrants from Yemen (38.5%, a difference of 0.21%), Cheyenne (38.5%, a difference of 0.25%), Sioux (38.8%, a difference of 0.49%), and Colville (39.3%, a difference of 1.8%).
| Demographics | Rating | Rank | Single Mother Poverty |
| Creek | 0.0 /100 | #331 | Tragic 36.7% |
| Dutch West Indians | 0.0 /100 | #332 | Tragic 36.8% |
| Menominee | 0.0 /100 | #333 | Tragic 37.1% |
| Pueblo | 0.0 /100 | #334 | Tragic 37.2% |
| Yuman | 0.0 /100 | #335 | Tragic 37.8% |
| Cheyenne | 0.0 /100 | #336 | Tragic 38.5% |
| Immigrants | Yemen | 0.0 /100 | #337 | Tragic 38.5% |
| Pima | 0.0 /100 | #338 | Tragic 38.6% |
| Crow | 0.0 /100 | #339 | Tragic 38.6% |
| Sioux | 0.0 /100 | #340 | Tragic 38.8% |
| Colville | 0.0 /100 | #341 | Tragic 39.3% |
| Navajo | 0.0 /100 | #342 | Tragic 40.2% |
| Cajuns | 0.0 /100 | #343 | Tragic 40.3% |
| Tohono O'odham | 0.0 /100 | #344 | Tragic 43.0% |
| Lumbee | 0.0 /100 | #345 | Tragic 43.2% |