Immigrants from Lithuania vs Immigrants from Serbia Births to Unmarried Women
COMPARE
Immigrants from Lithuania
Immigrants from Serbia
Births to Unmarried Women
Births to Unmarried Women Comparison
Immigrants from Lithuania
Immigrants from Serbia
27.7%
BIRTHS TO UNMARRIED WOMEN
99.5/ 100
METRIC RATING
46th/ 347
METRIC RANK
28.3%
BIRTHS TO UNMARRIED WOMEN
98.9/ 100
METRIC RATING
63rd/ 347
METRIC RANK
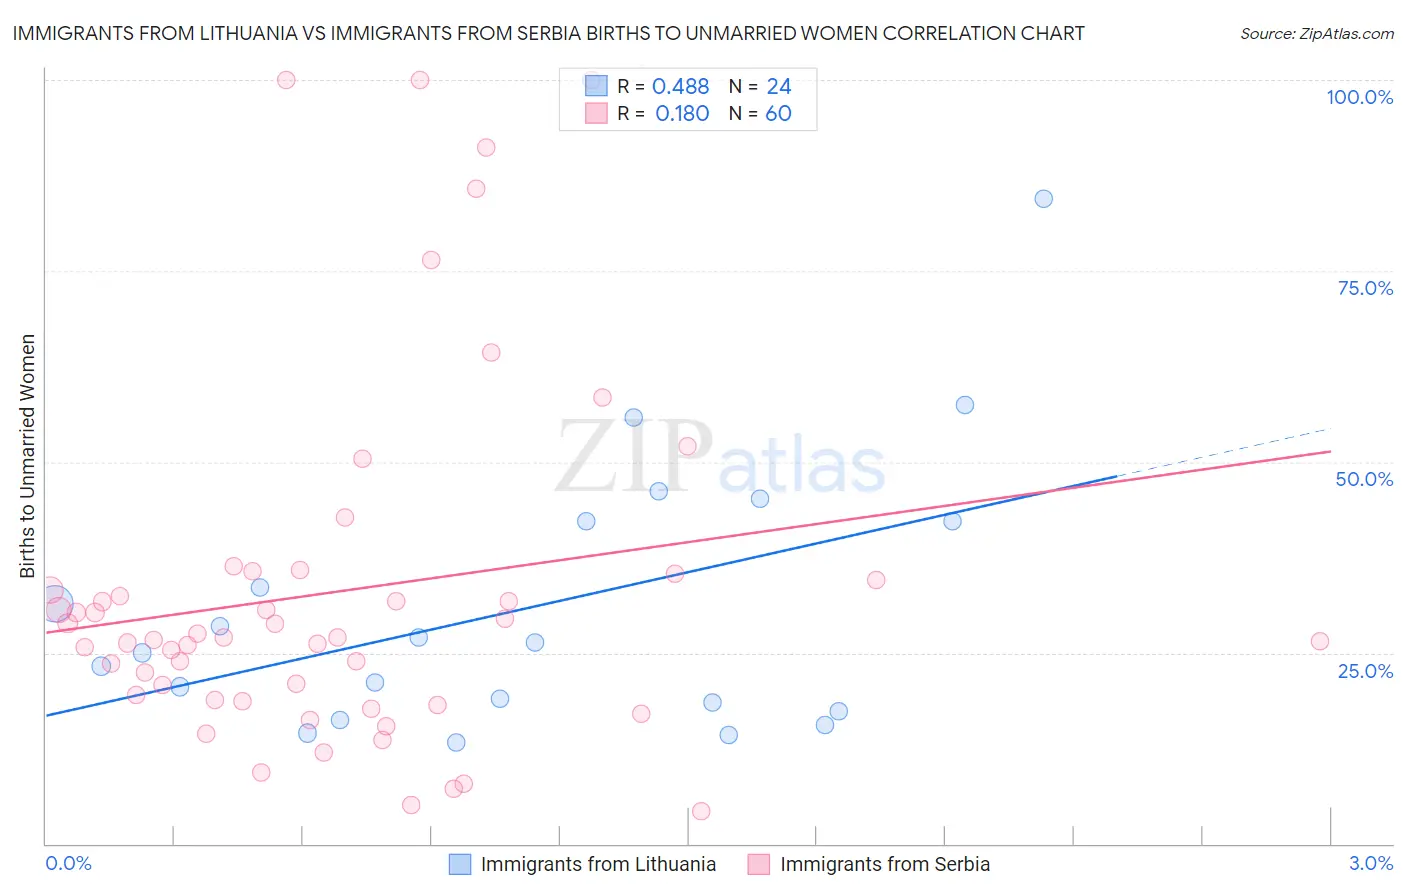
Immigrants from Lithuania vs Immigrants from Serbia Births to Unmarried Women Correlation Chart
The statistical analysis conducted on geographies consisting of 112,678,576 people shows a moderate positive correlation between the proportion of Immigrants from Lithuania and percentage of births to unmarried women in the United States with a correlation coefficient (R) of 0.488 and weighted average of 27.7%. Similarly, the statistical analysis conducted on geographies consisting of 126,646,358 people shows a poor positive correlation between the proportion of Immigrants from Serbia and percentage of births to unmarried women in the United States with a correlation coefficient (R) of 0.180 and weighted average of 28.3%, a difference of 1.9%.
Births to Unmarried Women Correlation Summary
| Measurement | Immigrants from Lithuania | Immigrants from Serbia |
| Minimum | 13.2% | 4.2% |
| Maximum | 84.4% | 100.0% |
| Range | 71.3% | 95.8% |
| Mean | 30.8% | 33.1% |
| Median | 25.7% | 27.0% |
| Interquartile 25% (IQ1) | 17.9% | 19.1% |
| Interquartile 75% (IQ3) | 42.3% | 35.0% |
| Interquartile Range (IQR) | 24.4% | 15.8% |
| Standard Deviation (Sample) | 17.5% | 23.2% |
| Standard Deviation (Population) | 17.1% | 23.0% |
Demographics Similar to Immigrants from Lithuania and Immigrants from Serbia by Births to Unmarried Women
In terms of births to unmarried women, the demographic groups most similar to Immigrants from Lithuania are Hmong (27.7%, a difference of 0.0%), Eastern European (27.7%, a difference of 0.010%), Latvian (27.7%, a difference of 0.040%), Immigrants from Indonesia (27.7%, a difference of 0.14%), and Immigrants from Greece (27.8%, a difference of 0.20%). Similarly, the demographic groups most similar to Immigrants from Serbia are Egyptian (28.2%, a difference of 0.14%), Tongan (28.4%, a difference of 0.38%), Immigrants from North Macedonia (28.1%, a difference of 0.46%), Immigrants from Turkey (28.1%, a difference of 0.51%), and Immigrants from Kazakhstan (28.1%, a difference of 0.55%).
| Demographics | Rating | Rank | Births to Unmarried Women |
| Immigrants | Indonesia | 99.5 /100 | #44 | Exceptional 27.7% |
| Latvians | 99.5 /100 | #45 | Exceptional 27.7% |
| Immigrants | Lithuania | 99.5 /100 | #46 | Exceptional 27.7% |
| Hmong | 99.5 /100 | #47 | Exceptional 27.7% |
| Eastern Europeans | 99.5 /100 | #48 | Exceptional 27.7% |
| Immigrants | Greece | 99.4 /100 | #49 | Exceptional 27.8% |
| Maltese | 99.4 /100 | #50 | Exceptional 27.8% |
| Macedonians | 99.4 /100 | #51 | Exceptional 27.9% |
| Bhutanese | 99.4 /100 | #52 | Exceptional 27.9% |
| Immigrants | Romania | 99.4 /100 | #53 | Exceptional 27.9% |
| Afghans | 99.4 /100 | #54 | Exceptional 27.9% |
| Mongolians | 99.3 /100 | #55 | Exceptional 27.9% |
| Immigrants | Belgium | 99.3 /100 | #56 | Exceptional 28.0% |
| Russians | 99.2 /100 | #57 | Exceptional 28.0% |
| Immigrants | Albania | 99.2 /100 | #58 | Exceptional 28.0% |
| Immigrants | Kazakhstan | 99.1 /100 | #59 | Exceptional 28.1% |
| Immigrants | Turkey | 99.1 /100 | #60 | Exceptional 28.1% |
| Immigrants | North Macedonia | 99.1 /100 | #61 | Exceptional 28.1% |
| Egyptians | 99.0 /100 | #62 | Exceptional 28.2% |
| Immigrants | Serbia | 98.9 /100 | #63 | Exceptional 28.3% |
| Tongans | 98.8 /100 | #64 | Exceptional 28.4% |