Bulgarian vs Immigrants from Korea Female Poverty Among 18-24 Year Olds
COMPARE
Bulgarian
Immigrants from Korea
Female Poverty Among 18-24 Year Olds
Female Poverty Among 18-24 Year Olds Comparison
Bulgarians
Immigrants from Korea
18.1%
FEMALE POVERTY AMONG 18-24 YEAR OLDS
100.0/ 100
METRIC RATING
42nd/ 347
METRIC RANK
18.6%
FEMALE POVERTY AMONG 18-24 YEAR OLDS
99.8/ 100
METRIC RATING
67th/ 347
METRIC RANK
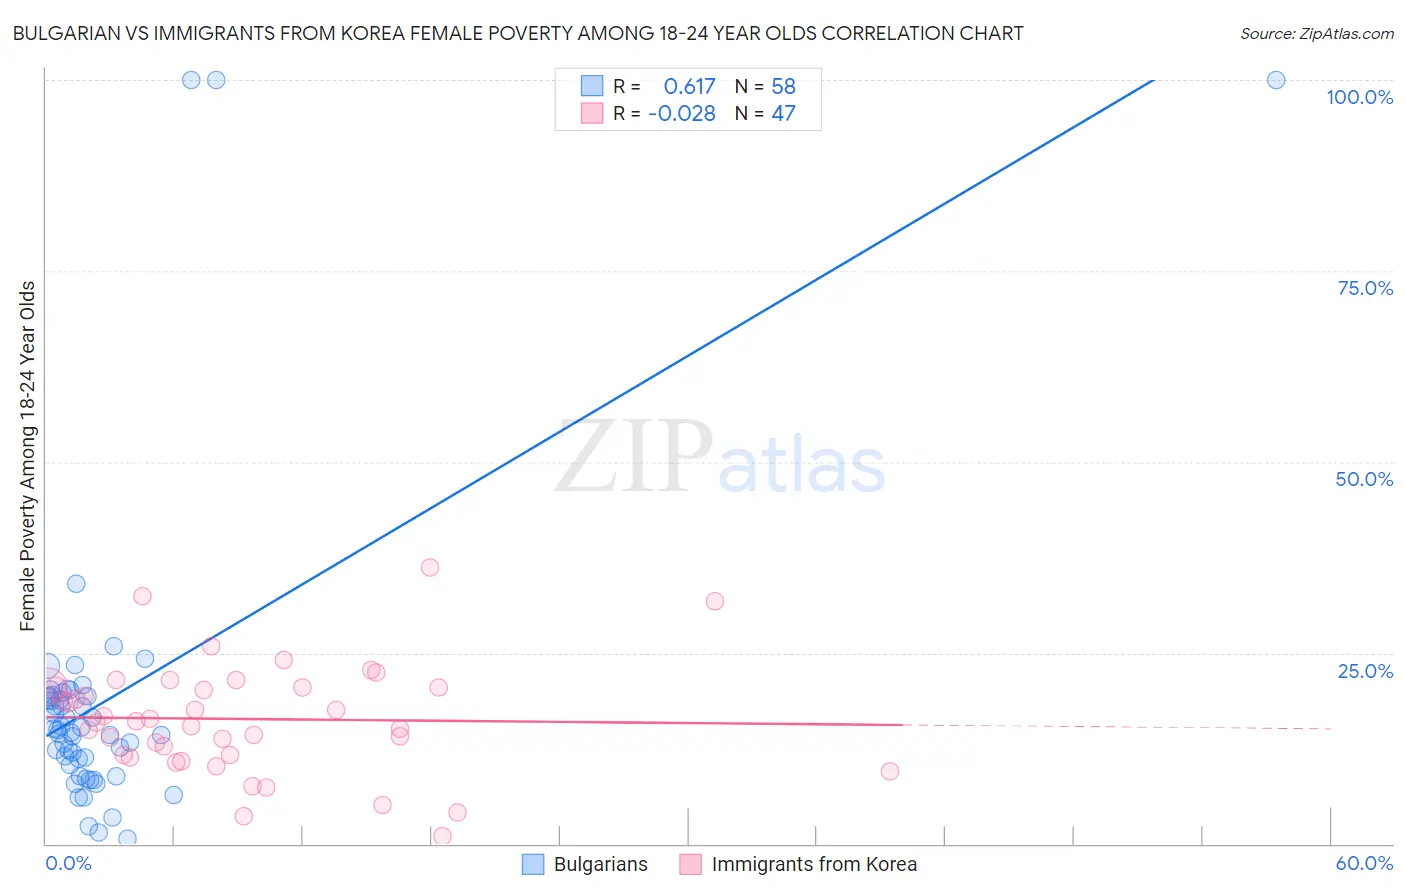
Bulgarian vs Immigrants from Korea Female Poverty Among 18-24 Year Olds Correlation Chart
The statistical analysis conducted on geographies consisting of 202,813,744 people shows a significant positive correlation between the proportion of Bulgarians and poverty level among females between the ages 18 and 24 in the United States with a correlation coefficient (R) of 0.617 and weighted average of 18.1%. Similarly, the statistical analysis conducted on geographies consisting of 404,235,363 people shows no correlation between the proportion of Immigrants from Korea and poverty level among females between the ages 18 and 24 in the United States with a correlation coefficient (R) of -0.028 and weighted average of 18.6%, a difference of 3.0%.
Female Poverty Among 18-24 Year Olds Correlation Summary
| Measurement | Bulgarian | Immigrants from Korea |
| Minimum | 0.62% | 0.99% |
| Maximum | 100.0% | 36.2% |
| Range | 99.4% | 35.2% |
| Mean | 18.8% | 16.3% |
| Median | 14.7% | 16.0% |
| Interquartile 25% (IQ1) | 10.4% | 11.6% |
| Interquartile 75% (IQ3) | 19.4% | 20.5% |
| Interquartile Range (IQR) | 9.0% | 8.9% |
| Standard Deviation (Sample) | 20.2% | 7.2% |
| Standard Deviation (Population) | 20.0% | 7.2% |
Similar Demographics by Female Poverty Among 18-24 Year Olds
Demographics Similar to Bulgarians by Female Poverty Among 18-24 Year Olds
In terms of female poverty among 18-24 year olds, the demographic groups most similar to Bulgarians are Macedonian (18.1%, a difference of 0.010%), Nicaraguan (18.1%, a difference of 0.090%), Spanish American Indian (18.1%, a difference of 0.18%), Immigrants from Argentina (18.0%, a difference of 0.47%), and Immigrants from Southern Europe (18.2%, a difference of 0.47%).
| Demographics | Rating | Rank | Female Poverty Among 18-24 Year Olds |
| Immigrants | Greece | 100.0 /100 | #35 | Exceptional 17.9% |
| Immigrants | South America | 100.0 /100 | #36 | Exceptional 17.9% |
| Immigrants | Croatia | 100.0 /100 | #37 | Exceptional 17.9% |
| South Americans | 100.0 /100 | #38 | Exceptional 18.0% |
| Puget Sound Salish | 100.0 /100 | #39 | Exceptional 18.0% |
| Immigrants | Romania | 100.0 /100 | #40 | Exceptional 18.0% |
| Immigrants | Argentina | 100.0 /100 | #41 | Exceptional 18.0% |
| Bulgarians | 100.0 /100 | #42 | Exceptional 18.1% |
| Macedonians | 100.0 /100 | #43 | Exceptional 18.1% |
| Nicaraguans | 100.0 /100 | #44 | Exceptional 18.1% |
| Spanish American Indians | 100.0 /100 | #45 | Exceptional 18.1% |
| Immigrants | Southern Europe | 100.0 /100 | #46 | Exceptional 18.2% |
| Asians | 100.0 /100 | #47 | Exceptional 18.2% |
| Sri Lankans | 100.0 /100 | #48 | Exceptional 18.2% |
| Bhutanese | 100.0 /100 | #49 | Exceptional 18.2% |
Demographics Similar to Immigrants from Korea by Female Poverty Among 18-24 Year Olds
In terms of female poverty among 18-24 year olds, the demographic groups most similar to Immigrants from Korea are Brazilian (18.6%, a difference of 0.030%), Immigrants from Bulgaria (18.6%, a difference of 0.15%), Jordanian (18.6%, a difference of 0.17%), Immigrants from Costa Rica (18.7%, a difference of 0.26%), and Immigrants from Haiti (18.7%, a difference of 0.32%).
| Demographics | Rating | Rank | Female Poverty Among 18-24 Year Olds |
| Immigrants | Brazil | 99.8 /100 | #60 | Exceptional 18.5% |
| Immigrants | Albania | 99.8 /100 | #61 | Exceptional 18.5% |
| Greeks | 99.8 /100 | #62 | Exceptional 18.5% |
| Immigrants | Belarus | 99.8 /100 | #63 | Exceptional 18.5% |
| Immigrants | Asia | 99.8 /100 | #64 | Exceptional 18.6% |
| Immigrants | Scotland | 99.8 /100 | #65 | Exceptional 18.6% |
| Jordanians | 99.8 /100 | #66 | Exceptional 18.6% |
| Immigrants | Korea | 99.8 /100 | #67 | Exceptional 18.6% |
| Brazilians | 99.8 /100 | #68 | Exceptional 18.6% |
| Immigrants | Bulgaria | 99.7 /100 | #69 | Exceptional 18.6% |
| Immigrants | Costa Rica | 99.7 /100 | #70 | Exceptional 18.7% |
| Immigrants | Haiti | 99.7 /100 | #71 | Exceptional 18.7% |
| Armenians | 99.7 /100 | #72 | Exceptional 18.7% |
| Lithuanians | 99.7 /100 | #73 | Exceptional 18.7% |
| Hawaiians | 99.6 /100 | #74 | Exceptional 18.7% |