Luxembourger vs Immigrants from Korea Female Poverty Among 18-24 Year Olds
COMPARE
Luxembourger
Immigrants from Korea
Female Poverty Among 18-24 Year Olds
Female Poverty Among 18-24 Year Olds Comparison
Luxembourgers
Immigrants from Korea
20.9%
FEMALE POVERTY AMONG 18-24 YEAR OLDS
4.2/ 100
METRIC RATING
240th/ 347
METRIC RANK
18.6%
FEMALE POVERTY AMONG 18-24 YEAR OLDS
99.8/ 100
METRIC RATING
67th/ 347
METRIC RANK
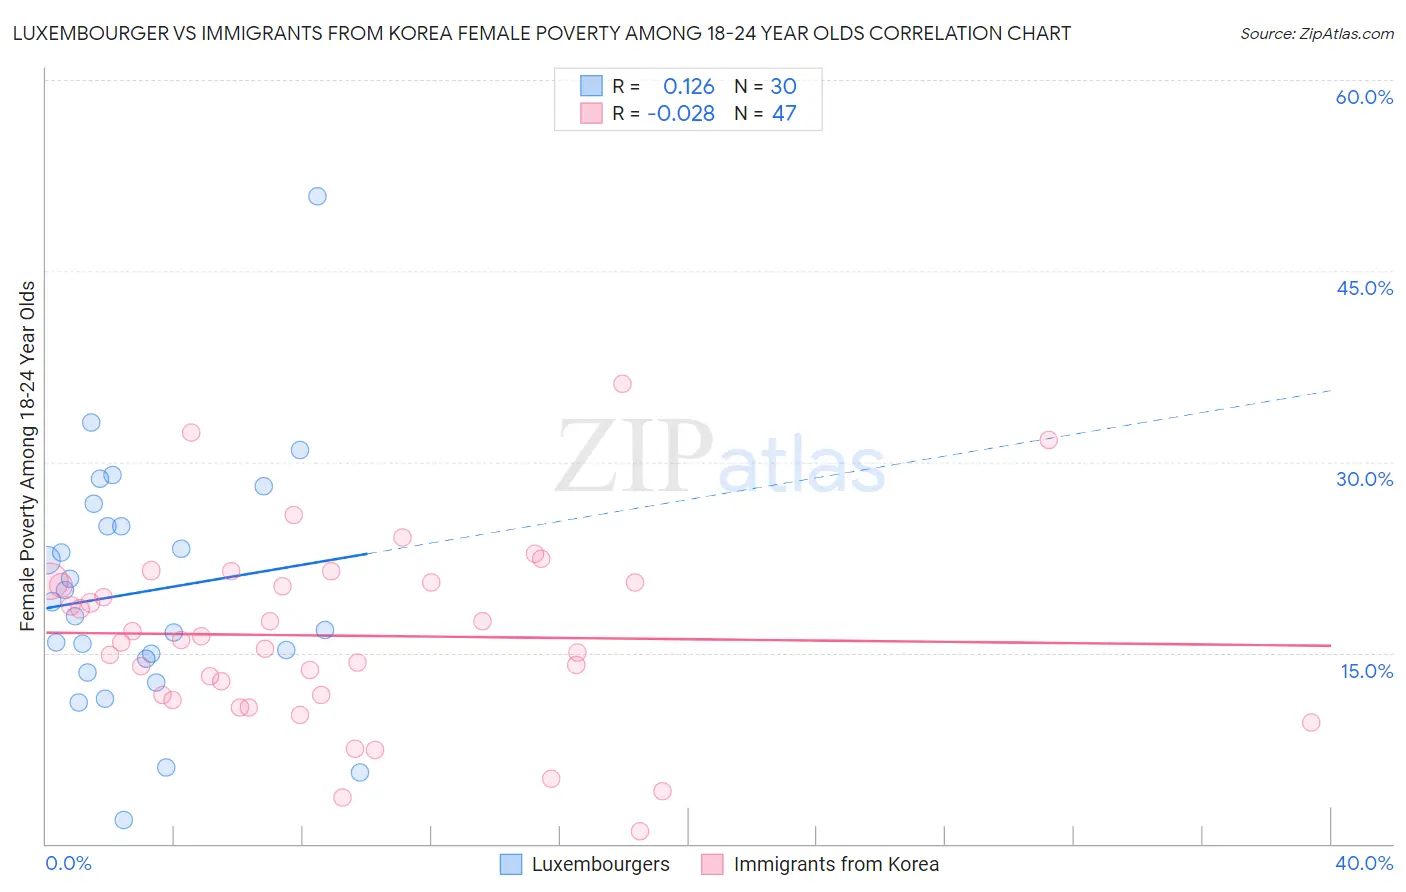
Luxembourger vs Immigrants from Korea Female Poverty Among 18-24 Year Olds Correlation Chart
The statistical analysis conducted on geographies consisting of 142,199,227 people shows a poor positive correlation between the proportion of Luxembourgers and poverty level among females between the ages 18 and 24 in the United States with a correlation coefficient (R) of 0.126 and weighted average of 20.9%. Similarly, the statistical analysis conducted on geographies consisting of 404,235,363 people shows no correlation between the proportion of Immigrants from Korea and poverty level among females between the ages 18 and 24 in the United States with a correlation coefficient (R) of -0.028 and weighted average of 18.6%, a difference of 12.1%.
Female Poverty Among 18-24 Year Olds Correlation Summary
| Measurement | Luxembourger | Immigrants from Korea |
| Minimum | 1.9% | 0.99% |
| Maximum | 50.8% | 36.2% |
| Range | 49.0% | 35.2% |
| Mean | 19.8% | 16.3% |
| Median | 18.4% | 16.0% |
| Interquartile 25% (IQ1) | 14.5% | 11.6% |
| Interquartile 75% (IQ3) | 24.9% | 20.5% |
| Interquartile Range (IQR) | 10.5% | 8.9% |
| Standard Deviation (Sample) | 9.7% | 7.2% |
| Standard Deviation (Population) | 9.5% | 7.2% |
Similar Demographics by Female Poverty Among 18-24 Year Olds
Demographics Similar to Luxembourgers by Female Poverty Among 18-24 Year Olds
In terms of female poverty among 18-24 year olds, the demographic groups most similar to Luxembourgers are Immigrants from Eritrea (20.9%, a difference of 0.020%), Immigrants from Guatemala (20.9%, a difference of 0.030%), Israeli (20.9%, a difference of 0.030%), Immigrants from Singapore (20.9%, a difference of 0.040%), and Scottish (20.9%, a difference of 0.070%).
| Demographics | Rating | Rank | Female Poverty Among 18-24 Year Olds |
| Immigrants | Denmark | 5.8 /100 | #233 | Tragic 20.8% |
| Welsh | 5.4 /100 | #234 | Tragic 20.8% |
| Immigrants | Uganda | 5.1 /100 | #235 | Tragic 20.8% |
| Okinawans | 4.9 /100 | #236 | Tragic 20.8% |
| Scottish | 4.5 /100 | #237 | Tragic 20.9% |
| Immigrants | Singapore | 4.4 /100 | #238 | Tragic 20.9% |
| Immigrants | Guatemala | 4.3 /100 | #239 | Tragic 20.9% |
| Luxembourgers | 4.2 /100 | #240 | Tragic 20.9% |
| Immigrants | Eritrea | 4.2 /100 | #241 | Tragic 20.9% |
| Israelis | 4.1 /100 | #242 | Tragic 20.9% |
| Marshallese | 3.4 /100 | #243 | Tragic 20.9% |
| Immigrants | Thailand | 3.4 /100 | #244 | Tragic 20.9% |
| Aleuts | 3.3 /100 | #245 | Tragic 20.9% |
| Immigrants | Australia | 3.1 /100 | #246 | Tragic 20.9% |
| Immigrants | Africa | 3.0 /100 | #247 | Tragic 21.0% |
Demographics Similar to Immigrants from Korea by Female Poverty Among 18-24 Year Olds
In terms of female poverty among 18-24 year olds, the demographic groups most similar to Immigrants from Korea are Brazilian (18.6%, a difference of 0.030%), Immigrants from Bulgaria (18.6%, a difference of 0.15%), Jordanian (18.6%, a difference of 0.17%), Immigrants from Costa Rica (18.7%, a difference of 0.26%), and Immigrants from Haiti (18.7%, a difference of 0.32%).
| Demographics | Rating | Rank | Female Poverty Among 18-24 Year Olds |
| Immigrants | Brazil | 99.8 /100 | #60 | Exceptional 18.5% |
| Immigrants | Albania | 99.8 /100 | #61 | Exceptional 18.5% |
| Greeks | 99.8 /100 | #62 | Exceptional 18.5% |
| Immigrants | Belarus | 99.8 /100 | #63 | Exceptional 18.5% |
| Immigrants | Asia | 99.8 /100 | #64 | Exceptional 18.6% |
| Immigrants | Scotland | 99.8 /100 | #65 | Exceptional 18.6% |
| Jordanians | 99.8 /100 | #66 | Exceptional 18.6% |
| Immigrants | Korea | 99.8 /100 | #67 | Exceptional 18.6% |
| Brazilians | 99.8 /100 | #68 | Exceptional 18.6% |
| Immigrants | Bulgaria | 99.7 /100 | #69 | Exceptional 18.6% |
| Immigrants | Costa Rica | 99.7 /100 | #70 | Exceptional 18.7% |
| Immigrants | Haiti | 99.7 /100 | #71 | Exceptional 18.7% |
| Armenians | 99.7 /100 | #72 | Exceptional 18.7% |
| Lithuanians | 99.7 /100 | #73 | Exceptional 18.7% |
| Hawaiians | 99.6 /100 | #74 | Exceptional 18.7% |