Immigrants from Latin America vs Cambodian Female Poverty Among 18-24 Year Olds
COMPARE
Immigrants from Latin America
Cambodian
Female Poverty Among 18-24 Year Olds
Female Poverty Among 18-24 Year Olds Comparison
Immigrants from Latin America
Cambodians
19.7%
FEMALE POVERTY AMONG 18-24 YEAR OLDS
81.3/ 100
METRIC RATING
148th/ 347
METRIC RANK
19.4%
FEMALE POVERTY AMONG 18-24 YEAR OLDS
94.6/ 100
METRIC RATING
122nd/ 347
METRIC RANK
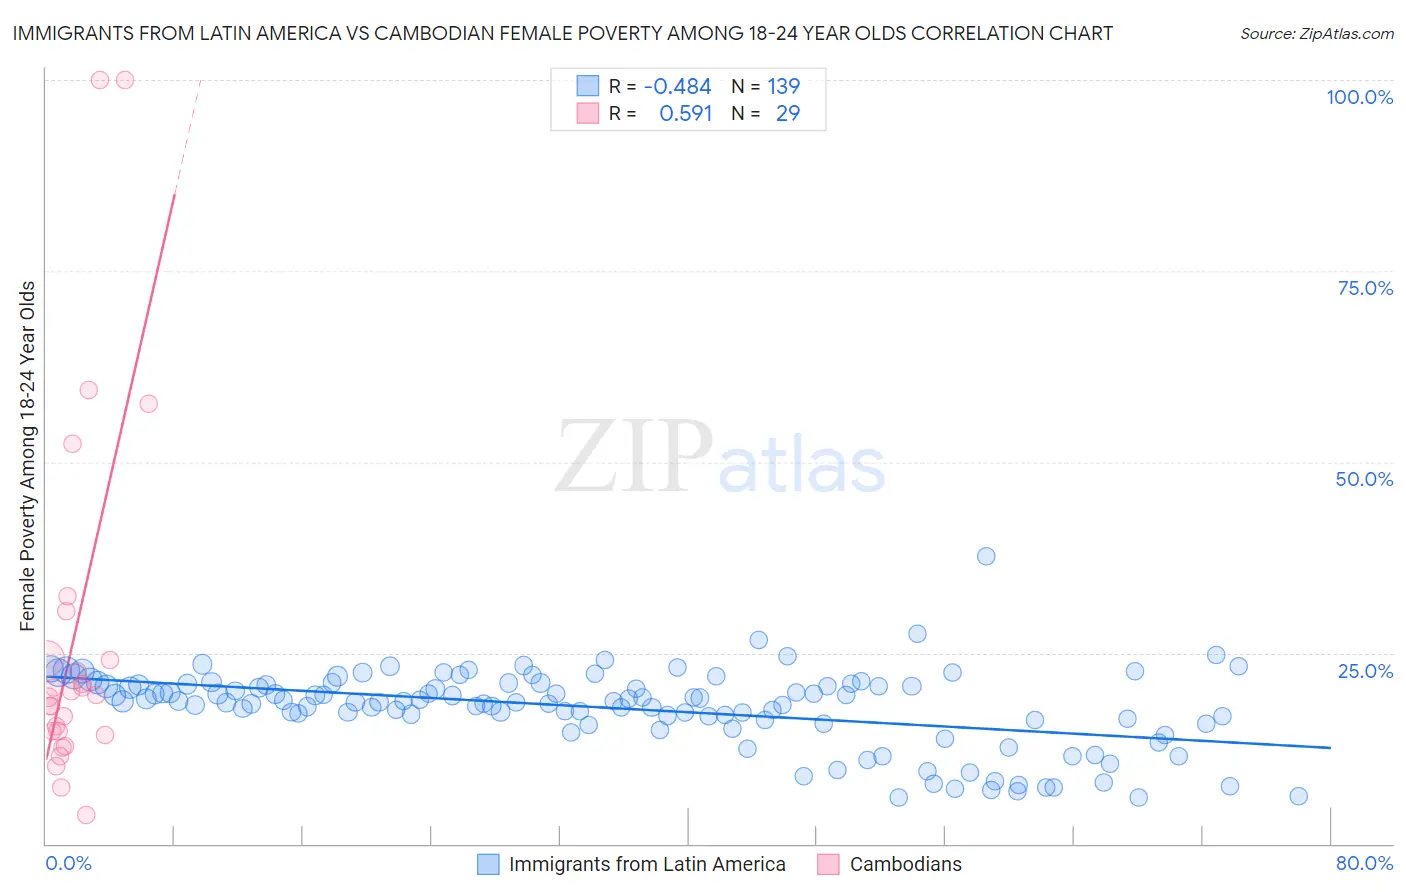
Immigrants from Latin America vs Cambodian Female Poverty Among 18-24 Year Olds Correlation Chart
The statistical analysis conducted on geographies consisting of 529,992,515 people shows a moderate negative correlation between the proportion of Immigrants from Latin America and poverty level among females between the ages 18 and 24 in the United States with a correlation coefficient (R) of -0.484 and weighted average of 19.7%. Similarly, the statistical analysis conducted on geographies consisting of 101,940,154 people shows a substantial positive correlation between the proportion of Cambodians and poverty level among females between the ages 18 and 24 in the United States with a correlation coefficient (R) of 0.591 and weighted average of 19.4%, a difference of 1.8%.
Female Poverty Among 18-24 Year Olds Correlation Summary
| Measurement | Immigrants from Latin America | Cambodian |
| Minimum | 6.0% | 3.8% |
| Maximum | 37.6% | 100.0% |
| Range | 31.6% | 96.2% |
| Mean | 17.8% | 27.4% |
| Median | 18.7% | 19.4% |
| Interquartile 25% (IQ1) | 16.1% | 14.5% |
| Interquartile 75% (IQ3) | 20.9% | 27.4% |
| Interquartile Range (IQR) | 4.8% | 12.8% |
| Standard Deviation (Sample) | 5.1% | 24.2% |
| Standard Deviation (Population) | 5.1% | 23.8% |
Similar Demographics by Female Poverty Among 18-24 Year Olds
Demographics Similar to Immigrants from Latin America by Female Poverty Among 18-24 Year Olds
In terms of female poverty among 18-24 year olds, the demographic groups most similar to Immigrants from Latin America are Immigrants from Oceania (19.7%, a difference of 0.010%), Syrian (19.8%, a difference of 0.090%), Immigrants from Eastern Asia (19.8%, a difference of 0.13%), Immigrants from Austria (19.7%, a difference of 0.15%), and Yugoslavian (19.8%, a difference of 0.18%).
| Demographics | Rating | Rank | Female Poverty Among 18-24 Year Olds |
| Pennsylvania Germans | 85.5 /100 | #141 | Excellent 19.7% |
| Panamanians | 84.6 /100 | #142 | Excellent 19.7% |
| Slavs | 84.4 /100 | #143 | Excellent 19.7% |
| Immigrants | Northern Africa | 84.1 /100 | #144 | Excellent 19.7% |
| Canadians | 83.8 /100 | #145 | Excellent 19.7% |
| Immigrants | Bosnia and Herzegovina | 83.6 /100 | #146 | Excellent 19.7% |
| Immigrants | Austria | 83.1 /100 | #147 | Excellent 19.7% |
| Immigrants | Latin America | 81.3 /100 | #148 | Excellent 19.7% |
| Immigrants | Oceania | 81.2 /100 | #149 | Excellent 19.7% |
| Syrians | 80.2 /100 | #150 | Excellent 19.8% |
| Immigrants | Eastern Asia | 79.7 /100 | #151 | Good 19.8% |
| Yugoslavians | 79.0 /100 | #152 | Good 19.8% |
| Immigrants | Japan | 78.1 /100 | #153 | Good 19.8% |
| Immigrants | Zimbabwe | 76.7 /100 | #154 | Good 19.8% |
| Hungarians | 76.6 /100 | #155 | Good 19.8% |
Demographics Similar to Cambodians by Female Poverty Among 18-24 Year Olds
In terms of female poverty among 18-24 year olds, the demographic groups most similar to Cambodians are Paraguayan (19.4%, a difference of 0.010%), Immigrants from Chile (19.4%, a difference of 0.070%), Immigrants from Panama (19.4%, a difference of 0.14%), Guyanese (19.4%, a difference of 0.19%), and Immigrants from Russia (19.4%, a difference of 0.20%).
| Demographics | Rating | Rank | Female Poverty Among 18-24 Year Olds |
| Immigrants | Hungary | 96.2 /100 | #115 | Exceptional 19.3% |
| Immigrants | Immigrants | 95.9 /100 | #116 | Exceptional 19.3% |
| Immigrants | Iran | 95.8 /100 | #117 | Exceptional 19.3% |
| Immigrants | Guyana | 95.6 /100 | #118 | Exceptional 19.3% |
| Cypriots | 95.5 /100 | #119 | Exceptional 19.3% |
| Immigrants | Northern Europe | 95.4 /100 | #120 | Exceptional 19.4% |
| Guyanese | 95.3 /100 | #121 | Exceptional 19.4% |
| Cambodians | 94.6 /100 | #122 | Exceptional 19.4% |
| Paraguayans | 94.6 /100 | #123 | Exceptional 19.4% |
| Immigrants | Chile | 94.3 /100 | #124 | Exceptional 19.4% |
| Immigrants | Panama | 94.0 /100 | #125 | Exceptional 19.4% |
| Immigrants | Russia | 93.7 /100 | #126 | Exceptional 19.4% |
| Cape Verdeans | 93.6 /100 | #127 | Exceptional 19.4% |
| Slovaks | 92.9 /100 | #128 | Exceptional 19.5% |
| Immigrants | England | 92.9 /100 | #129 | Exceptional 19.5% |