Immigrants from Latin America vs Italian Female Poverty Among 18-24 Year Olds
COMPARE
Immigrants from Latin America
Italian
Female Poverty Among 18-24 Year Olds
Female Poverty Among 18-24 Year Olds Comparison
Immigrants from Latin America
Italians
19.7%
FEMALE POVERTY AMONG 18-24 YEAR OLDS
81.3/ 100
METRIC RATING
148th/ 347
METRIC RANK
18.3%
FEMALE POVERTY AMONG 18-24 YEAR OLDS
99.9/ 100
METRIC RATING
53rd/ 347
METRIC RANK
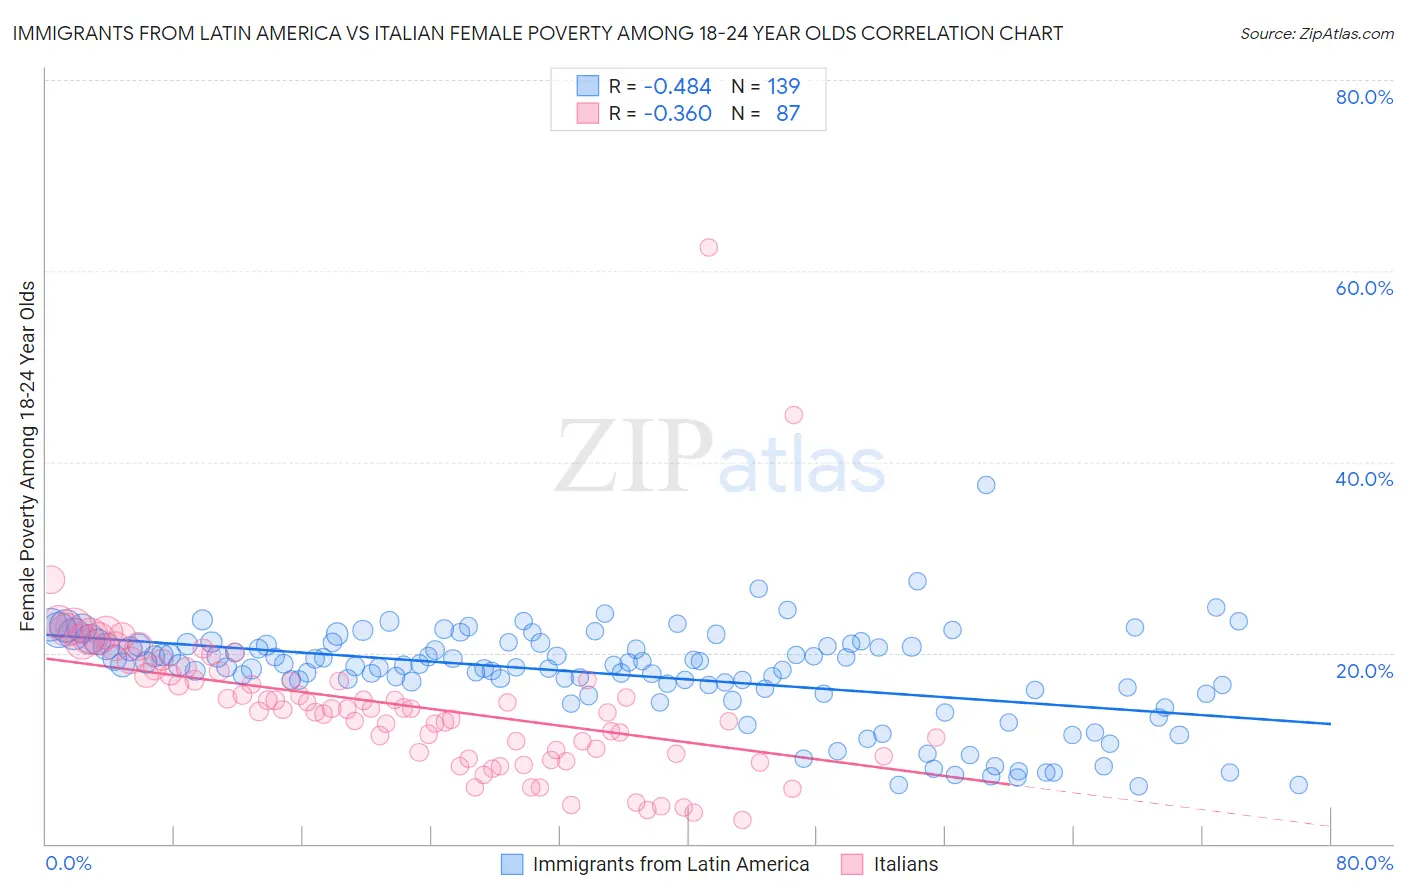
Immigrants from Latin America vs Italian Female Poverty Among 18-24 Year Olds Correlation Chart
The statistical analysis conducted on geographies consisting of 529,992,515 people shows a moderate negative correlation between the proportion of Immigrants from Latin America and poverty level among females between the ages 18 and 24 in the United States with a correlation coefficient (R) of -0.484 and weighted average of 19.7%. Similarly, the statistical analysis conducted on geographies consisting of 539,657,862 people shows a mild negative correlation between the proportion of Italians and poverty level among females between the ages 18 and 24 in the United States with a correlation coefficient (R) of -0.360 and weighted average of 18.3%, a difference of 7.7%.
Female Poverty Among 18-24 Year Olds Correlation Summary
| Measurement | Immigrants from Latin America | Italian |
| Minimum | 6.0% | 2.4% |
| Maximum | 37.6% | 62.5% |
| Range | 31.6% | 60.1% |
| Mean | 17.8% | 14.5% |
| Median | 18.7% | 14.1% |
| Interquartile 25% (IQ1) | 16.1% | 9.5% |
| Interquartile 75% (IQ3) | 20.9% | 17.7% |
| Interquartile Range (IQR) | 4.8% | 8.2% |
| Standard Deviation (Sample) | 5.1% | 8.3% |
| Standard Deviation (Population) | 5.1% | 8.2% |
Similar Demographics by Female Poverty Among 18-24 Year Olds
Demographics Similar to Immigrants from Latin America by Female Poverty Among 18-24 Year Olds
In terms of female poverty among 18-24 year olds, the demographic groups most similar to Immigrants from Latin America are Immigrants from Oceania (19.7%, a difference of 0.010%), Syrian (19.8%, a difference of 0.090%), Immigrants from Eastern Asia (19.8%, a difference of 0.13%), Immigrants from Austria (19.7%, a difference of 0.15%), and Yugoslavian (19.8%, a difference of 0.18%).
| Demographics | Rating | Rank | Female Poverty Among 18-24 Year Olds |
| Pennsylvania Germans | 85.5 /100 | #141 | Excellent 19.7% |
| Panamanians | 84.6 /100 | #142 | Excellent 19.7% |
| Slavs | 84.4 /100 | #143 | Excellent 19.7% |
| Immigrants | Northern Africa | 84.1 /100 | #144 | Excellent 19.7% |
| Canadians | 83.8 /100 | #145 | Excellent 19.7% |
| Immigrants | Bosnia and Herzegovina | 83.6 /100 | #146 | Excellent 19.7% |
| Immigrants | Austria | 83.1 /100 | #147 | Excellent 19.7% |
| Immigrants | Latin America | 81.3 /100 | #148 | Excellent 19.7% |
| Immigrants | Oceania | 81.2 /100 | #149 | Excellent 19.7% |
| Syrians | 80.2 /100 | #150 | Excellent 19.8% |
| Immigrants | Eastern Asia | 79.7 /100 | #151 | Good 19.8% |
| Yugoslavians | 79.0 /100 | #152 | Good 19.8% |
| Immigrants | Japan | 78.1 /100 | #153 | Good 19.8% |
| Immigrants | Zimbabwe | 76.7 /100 | #154 | Good 19.8% |
| Hungarians | 76.6 /100 | #155 | Good 19.8% |
Demographics Similar to Italians by Female Poverty Among 18-24 Year Olds
In terms of female poverty among 18-24 year olds, the demographic groups most similar to Italians are Immigrants from Ireland (18.3%, a difference of 0.090%), Immigrants from Egypt (18.4%, a difference of 0.22%), Albanian (18.4%, a difference of 0.23%), Argentinean (18.4%, a difference of 0.25%), and Immigrants from Italy (18.4%, a difference of 0.35%).
| Demographics | Rating | Rank | Female Poverty Among 18-24 Year Olds |
| Immigrants | Southern Europe | 100.0 /100 | #46 | Exceptional 18.2% |
| Asians | 100.0 /100 | #47 | Exceptional 18.2% |
| Sri Lankans | 100.0 /100 | #48 | Exceptional 18.2% |
| Bhutanese | 100.0 /100 | #49 | Exceptional 18.2% |
| Samoans | 100.0 /100 | #50 | Exceptional 18.2% |
| Immigrants | Eastern Europe | 99.9 /100 | #51 | Exceptional 18.2% |
| Immigrants | Ireland | 99.9 /100 | #52 | Exceptional 18.3% |
| Italians | 99.9 /100 | #53 | Exceptional 18.3% |
| Immigrants | Egypt | 99.9 /100 | #54 | Exceptional 18.4% |
| Albanians | 99.9 /100 | #55 | Exceptional 18.4% |
| Argentineans | 99.9 /100 | #56 | Exceptional 18.4% |
| Immigrants | Italy | 99.9 /100 | #57 | Exceptional 18.4% |
| Immigrants | Ukraine | 99.9 /100 | #58 | Exceptional 18.4% |
| Egyptians | 99.9 /100 | #59 | Exceptional 18.5% |
| Immigrants | Brazil | 99.8 /100 | #60 | Exceptional 18.5% |