Immigrants from Latin America vs Brazilian Single Mother Poverty
COMPARE
Immigrants from Latin America
Brazilian
Single Mother Poverty
Single Mother Poverty Comparison
Immigrants from Latin America
Brazilians
32.4%
SINGLE MOTHER POVERTY
0.0/ 100
METRIC RATING
285th/ 347
METRIC RANK
28.3%
SINGLE MOTHER POVERTY
92.4/ 100
METRIC RATING
118th/ 347
METRIC RANK
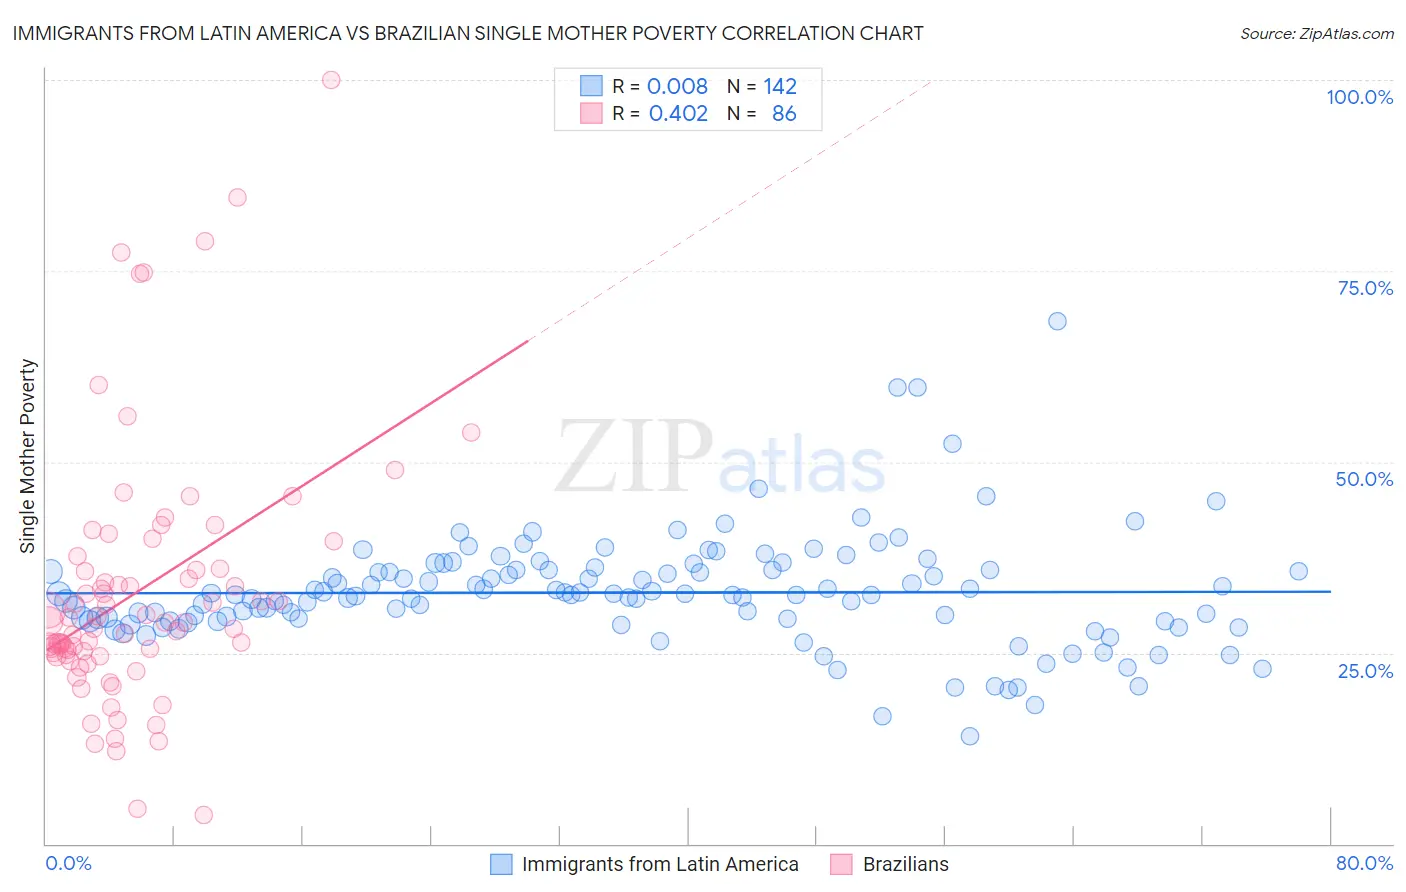
Immigrants from Latin America vs Brazilian Single Mother Poverty Correlation Chart
The statistical analysis conducted on geographies consisting of 534,740,135 people shows no correlation between the proportion of Immigrants from Latin America and poverty level among single mothers in the United States with a correlation coefficient (R) of 0.008 and weighted average of 32.4%. Similarly, the statistical analysis conducted on geographies consisting of 317,046,418 people shows a moderate positive correlation between the proportion of Brazilians and poverty level among single mothers in the United States with a correlation coefficient (R) of 0.402 and weighted average of 28.3%, a difference of 14.6%.
Single Mother Poverty Correlation Summary
| Measurement | Immigrants from Latin America | Brazilian |
| Minimum | 14.1% | 3.8% |
| Maximum | 68.5% | 100.0% |
| Range | 54.3% | 96.2% |
| Mean | 32.9% | 33.0% |
| Median | 32.6% | 29.0% |
| Interquartile 25% (IQ1) | 29.2% | 24.7% |
| Interquartile 75% (IQ3) | 35.8% | 36.1% |
| Interquartile Range (IQR) | 6.6% | 11.4% |
| Standard Deviation (Sample) | 7.3% | 16.9% |
| Standard Deviation (Population) | 7.3% | 16.8% |
Similar Demographics by Single Mother Poverty
Demographics Similar to Immigrants from Latin America by Single Mother Poverty
In terms of single mother poverty, the demographic groups most similar to Immigrants from Latin America are Yup'ik (32.5%, a difference of 0.070%), Indonesian (32.4%, a difference of 0.11%), Immigrants from Dominica (32.5%, a difference of 0.20%), Spanish American (32.3%, a difference of 0.41%), and Somali (32.6%, a difference of 0.43%).
| Demographics | Rating | Rank | Single Mother Poverty |
| Immigrants | Zaire | 0.0 /100 | #278 | Tragic 32.0% |
| Marshallese | 0.0 /100 | #279 | Tragic 32.1% |
| Immigrants | Nonimmigrants | 0.0 /100 | #280 | Tragic 32.2% |
| Cree | 0.0 /100 | #281 | Tragic 32.2% |
| Immigrants | Azores | 0.0 /100 | #282 | Tragic 32.2% |
| Spanish Americans | 0.0 /100 | #283 | Tragic 32.3% |
| Indonesians | 0.0 /100 | #284 | Tragic 32.4% |
| Immigrants | Latin America | 0.0 /100 | #285 | Tragic 32.4% |
| Yup'ik | 0.0 /100 | #286 | Tragic 32.5% |
| Immigrants | Dominica | 0.0 /100 | #287 | Tragic 32.5% |
| Somalis | 0.0 /100 | #288 | Tragic 32.6% |
| U.S. Virgin Islanders | 0.0 /100 | #289 | Tragic 32.6% |
| Osage | 0.0 /100 | #290 | Tragic 32.6% |
| Guatemalans | 0.0 /100 | #291 | Tragic 32.9% |
| Shoshone | 0.0 /100 | #292 | Tragic 32.9% |
Demographics Similar to Brazilians by Single Mother Poverty
In terms of single mother poverty, the demographic groups most similar to Brazilians are Australian (28.3%, a difference of 0.010%), Immigrants from Syria (28.3%, a difference of 0.010%), Immigrants from Uganda (28.3%, a difference of 0.020%), Cypriot (28.3%, a difference of 0.030%), and Immigrants from Kuwait (28.3%, a difference of 0.040%).
| Demographics | Rating | Rank | Single Mother Poverty |
| Venezuelans | 94.5 /100 | #111 | Exceptional 28.2% |
| Immigrants | Kazakhstan | 94.5 /100 | #112 | Exceptional 28.2% |
| Immigrants | South Africa | 93.2 /100 | #113 | Exceptional 28.3% |
| Immigrants | Western Asia | 92.7 /100 | #114 | Exceptional 28.3% |
| Immigrants | Kuwait | 92.7 /100 | #115 | Exceptional 28.3% |
| Immigrants | Uganda | 92.5 /100 | #116 | Exceptional 28.3% |
| Australians | 92.5 /100 | #117 | Exceptional 28.3% |
| Brazilians | 92.4 /100 | #118 | Exceptional 28.3% |
| Immigrants | Syria | 92.4 /100 | #119 | Exceptional 28.3% |
| Cypriots | 92.3 /100 | #120 | Exceptional 28.3% |
| Immigrants | Afghanistan | 92.1 /100 | #121 | Exceptional 28.3% |
| Colombians | 91.8 /100 | #122 | Exceptional 28.3% |
| Uruguayans | 91.7 /100 | #123 | Exceptional 28.3% |
| Immigrants | Switzerland | 91.7 /100 | #124 | Exceptional 28.3% |
| Kenyans | 90.9 /100 | #125 | Exceptional 28.4% |