Immigrants from Jordan vs Hungarian Child Poverty Under the Age of 16
COMPARE
Immigrants from Jordan
Hungarian
Child Poverty Under the Age of 16
Child Poverty Under the Age of 16 Comparison
Immigrants from Jordan
Hungarians
15.6%
CHILD POVERTY UNDER THE AGE OF 16
78.5/ 100
METRIC RATING
150th/ 347
METRIC RANK
16.2%
CHILD POVERTY UNDER THE AGE OF 16
52.5/ 100
METRIC RATING
171st/ 347
METRIC RANK
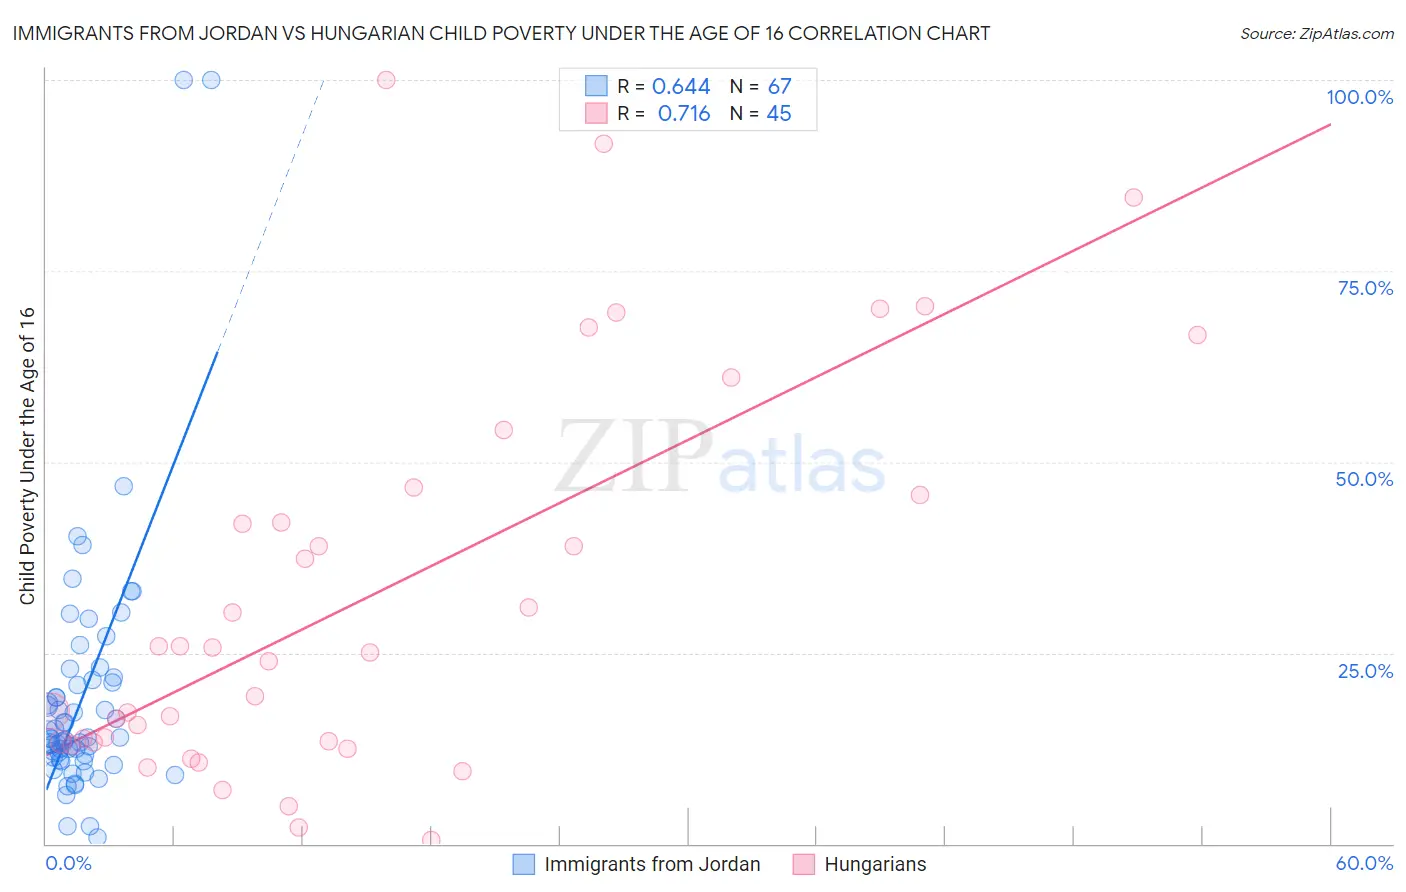
Immigrants from Jordan vs Hungarian Child Poverty Under the Age of 16 Correlation Chart
The statistical analysis conducted on geographies consisting of 180,809,646 people shows a significant positive correlation between the proportion of Immigrants from Jordan and poverty level among children under the age of 16 in the United States with a correlation coefficient (R) of 0.644 and weighted average of 15.6%. Similarly, the statistical analysis conducted on geographies consisting of 478,420,281 people shows a strong positive correlation between the proportion of Hungarians and poverty level among children under the age of 16 in the United States with a correlation coefficient (R) of 0.716 and weighted average of 16.2%, a difference of 3.7%.
Child Poverty Under the Age of 16 Correlation Summary
| Measurement | Immigrants from Jordan | Hungarian |
| Minimum | 0.79% | 0.42% |
| Maximum | 100.0% | 100.0% |
| Range | 99.2% | 99.6% |
| Mean | 19.2% | 32.6% |
| Median | 13.8% | 25.0% |
| Interquartile 25% (IQ1) | 11.3% | 13.3% |
| Interquartile 75% (IQ3) | 21.5% | 46.1% |
| Interquartile Range (IQR) | 10.2% | 32.8% |
| Standard Deviation (Sample) | 16.9% | 25.6% |
| Standard Deviation (Population) | 16.8% | 25.4% |
Similar Demographics by Child Poverty Under the Age of 16
Demographics Similar to Immigrants from Jordan by Child Poverty Under the Age of 16
In terms of child poverty under the age of 16, the demographic groups most similar to Immigrants from Jordan are French (15.6%, a difference of 0.0%), French Canadian (15.6%, a difference of 0.040%), Venezuelan (15.6%, a difference of 0.19%), Samoan (15.6%, a difference of 0.22%), and Israeli (15.5%, a difference of 0.32%).
| Demographics | Rating | Rank | Child Poverty Under the Age of 16 |
| Icelanders | 82.5 /100 | #143 | Excellent 15.4% |
| Immigrants | Hungary | 81.9 /100 | #144 | Excellent 15.5% |
| Immigrants | Peru | 81.7 /100 | #145 | Excellent 15.5% |
| Slovaks | 81.4 /100 | #146 | Excellent 15.5% |
| Immigrants | Kuwait | 80.5 /100 | #147 | Excellent 15.5% |
| Puget Sound Salish | 80.3 /100 | #148 | Excellent 15.5% |
| Israelis | 80.1 /100 | #149 | Excellent 15.5% |
| Immigrants | Jordan | 78.5 /100 | #150 | Good 15.6% |
| French | 78.5 /100 | #151 | Good 15.6% |
| French Canadians | 78.2 /100 | #152 | Good 15.6% |
| Venezuelans | 77.4 /100 | #153 | Good 15.6% |
| Samoans | 77.3 /100 | #154 | Good 15.6% |
| Syrians | 76.1 /100 | #155 | Good 15.6% |
| Immigrants | Venezuela | 74.9 /100 | #156 | Good 15.7% |
| Immigrants | Nepal | 72.9 /100 | #157 | Good 15.7% |
Demographics Similar to Hungarians by Child Poverty Under the Age of 16
In terms of child poverty under the age of 16, the demographic groups most similar to Hungarians are Afghan (16.2%, a difference of 0.020%), Immigrants from Saudi Arabia (16.2%, a difference of 0.050%), Immigrants from Colombia (16.1%, a difference of 0.23%), Uruguayan (16.1%, a difference of 0.27%), and White/Caucasian (16.2%, a difference of 0.30%).
| Demographics | Rating | Rank | Child Poverty Under the Age of 16 |
| Immigrants | Germany | 67.3 /100 | #164 | Good 15.8% |
| Guamanians/Chamorros | 66.4 /100 | #165 | Good 15.9% |
| Immigrants | Oceania | 65.4 /100 | #166 | Good 15.9% |
| Costa Ricans | 61.1 /100 | #167 | Good 16.0% |
| South Americans | 57.9 /100 | #168 | Average 16.0% |
| Uruguayans | 54.7 /100 | #169 | Average 16.1% |
| Immigrants | Colombia | 54.4 /100 | #170 | Average 16.1% |
| Hungarians | 52.5 /100 | #171 | Average 16.2% |
| Afghans | 52.3 /100 | #172 | Average 16.2% |
| Immigrants | Saudi Arabia | 52.1 /100 | #173 | Average 16.2% |
| Whites/Caucasians | 50.0 /100 | #174 | Average 16.2% |
| Scotch-Irish | 47.1 /100 | #175 | Average 16.3% |
| Lebanese | 45.9 /100 | #176 | Average 16.3% |
| Ethiopians | 43.4 /100 | #177 | Average 16.3% |
| Immigrants | Ethiopia | 42.3 /100 | #178 | Average 16.4% |