Immigrants from Japan vs Argentinean Single Mother Poverty
COMPARE
Immigrants from Japan
Argentinean
Single Mother Poverty
Single Mother Poverty Comparison
Immigrants from Japan
Argentineans
26.4%
SINGLE MOTHER POVERTY
100.0/ 100
METRIC RATING
27th/ 347
METRIC RANK
27.2%
SINGLE MOTHER POVERTY
99.6/ 100
METRIC RATING
58th/ 347
METRIC RANK
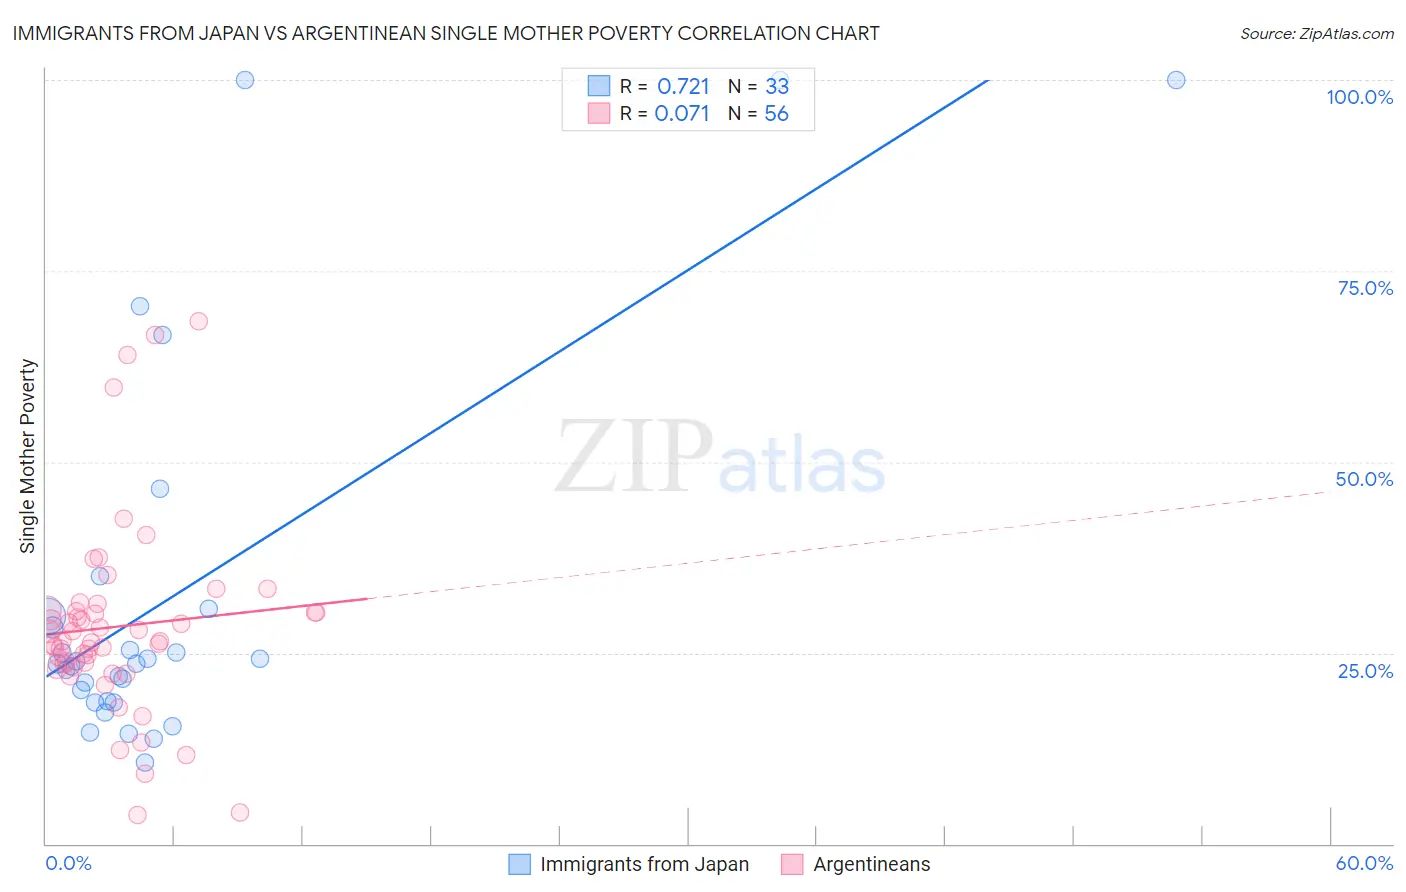
Immigrants from Japan vs Argentinean Single Mother Poverty Correlation Chart
The statistical analysis conducted on geographies consisting of 332,940,354 people shows a strong positive correlation between the proportion of Immigrants from Japan and poverty level among single mothers in the United States with a correlation coefficient (R) of 0.721 and weighted average of 26.4%. Similarly, the statistical analysis conducted on geographies consisting of 291,528,298 people shows a slight positive correlation between the proportion of Argentineans and poverty level among single mothers in the United States with a correlation coefficient (R) of 0.071 and weighted average of 27.2%, a difference of 3.1%.
Single Mother Poverty Correlation Summary
| Measurement | Immigrants from Japan | Argentinean |
| Minimum | 10.7% | 3.7% |
| Maximum | 100.0% | 68.3% |
| Range | 89.3% | 64.6% |
| Mean | 32.6% | 28.4% |
| Median | 23.6% | 26.5% |
| Interquartile 25% (IQ1) | 18.6% | 23.3% |
| Interquartile 75% (IQ3) | 30.2% | 30.6% |
| Interquartile Range (IQR) | 11.6% | 7.3% |
| Standard Deviation (Sample) | 25.2% | 12.7% |
| Standard Deviation (Population) | 24.8% | 12.6% |
Similar Demographics by Single Mother Poverty
Demographics Similar to Immigrants from Japan by Single Mother Poverty
In terms of single mother poverty, the demographic groups most similar to Immigrants from Japan are Korean (26.4%, a difference of 0.010%), Jordanian (26.4%, a difference of 0.070%), Turkish (26.4%, a difference of 0.15%), Immigrants from Sri Lanka (26.3%, a difference of 0.22%), and Immigrants from Philippines (26.5%, a difference of 0.31%).
| Demographics | Rating | Rank | Single Mother Poverty |
| Immigrants | China | 100.0 /100 | #20 | Exceptional 26.1% |
| Immigrants | Bolivia | 100.0 /100 | #21 | Exceptional 26.2% |
| Immigrants | Korea | 100.0 /100 | #22 | Exceptional 26.2% |
| Burmese | 100.0 /100 | #23 | Exceptional 26.2% |
| Immigrants | Moldova | 100.0 /100 | #24 | Exceptional 26.2% |
| Immigrants | Asia | 100.0 /100 | #25 | Exceptional 26.3% |
| Immigrants | Sri Lanka | 100.0 /100 | #26 | Exceptional 26.3% |
| Immigrants | Japan | 100.0 /100 | #27 | Exceptional 26.4% |
| Koreans | 100.0 /100 | #28 | Exceptional 26.4% |
| Jordanians | 100.0 /100 | #29 | Exceptional 26.4% |
| Turks | 100.0 /100 | #30 | Exceptional 26.4% |
| Immigrants | Philippines | 100.0 /100 | #31 | Exceptional 26.5% |
| Tongans | 99.9 /100 | #32 | Exceptional 26.5% |
| Bulgarians | 99.9 /100 | #33 | Exceptional 26.5% |
| Immigrants | Indonesia | 99.9 /100 | #34 | Exceptional 26.6% |
Demographics Similar to Argentineans by Single Mother Poverty
In terms of single mother poverty, the demographic groups most similar to Argentineans are Paraguayan (27.2%, a difference of 0.010%), Eastern European (27.2%, a difference of 0.050%), Palestinian (27.2%, a difference of 0.15%), Immigrants from Eastern Europe (27.2%, a difference of 0.16%), and Immigrants from Romania (27.2%, a difference of 0.18%).
| Demographics | Rating | Rank | Single Mother Poverty |
| Immigrants | Argentina | 99.7 /100 | #51 | Exceptional 27.1% |
| Immigrants | South Eastern Asia | 99.7 /100 | #52 | Exceptional 27.1% |
| Immigrants | Jordan | 99.7 /100 | #53 | Exceptional 27.1% |
| Immigrants | Bulgaria | 99.7 /100 | #54 | Exceptional 27.1% |
| Immigrants | Egypt | 99.7 /100 | #55 | Exceptional 27.1% |
| Immigrants | Romania | 99.7 /100 | #56 | Exceptional 27.2% |
| Palestinians | 99.7 /100 | #57 | Exceptional 27.2% |
| Argentineans | 99.6 /100 | #58 | Exceptional 27.2% |
| Paraguayans | 99.6 /100 | #59 | Exceptional 27.2% |
| Eastern Europeans | 99.6 /100 | #60 | Exceptional 27.2% |
| Immigrants | Eastern Europe | 99.6 /100 | #61 | Exceptional 27.2% |
| Immigrants | Malaysia | 99.5 /100 | #62 | Exceptional 27.3% |
| Immigrants | Northern Europe | 99.5 /100 | #63 | Exceptional 27.3% |
| Russians | 99.5 /100 | #64 | Exceptional 27.3% |
| Immigrants | Turkey | 99.5 /100 | #65 | Exceptional 27.3% |