Immigrants from Japan vs Immigrants from Ecuador Seniors Poverty Over the Age of 75
COMPARE
Immigrants from Japan
Immigrants from Ecuador
Seniors Poverty Over the Age of 75
Seniors Poverty Over the Age of 75 Comparison
Immigrants from Japan
Immigrants from Ecuador
11.6%
SENIORS POVERTY OVER THE AGE OF 75
91.9/ 100
METRIC RATING
98th/ 347
METRIC RANK
16.1%
SENIORS POVERTY OVER THE AGE OF 75
0.0/ 100
METRIC RATING
316th/ 347
METRIC RANK
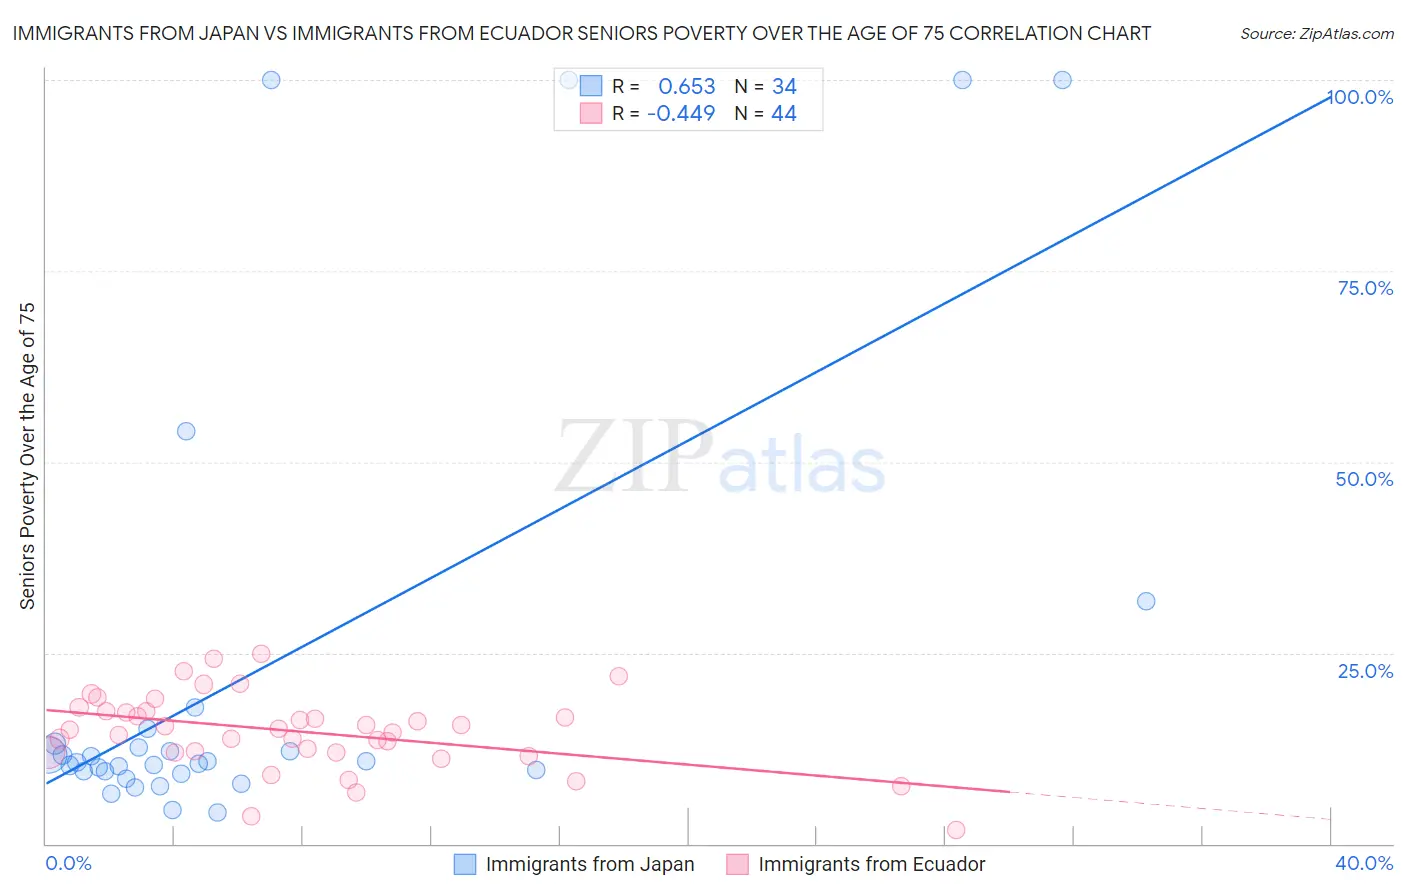
Immigrants from Japan vs Immigrants from Ecuador Seniors Poverty Over the Age of 75 Correlation Chart
The statistical analysis conducted on geographies consisting of 336,933,586 people shows a significant positive correlation between the proportion of Immigrants from Japan and poverty level among seniors over the age of 75 in the United States with a correlation coefficient (R) of 0.653 and weighted average of 11.6%. Similarly, the statistical analysis conducted on geographies consisting of 268,811,493 people shows a moderate negative correlation between the proportion of Immigrants from Ecuador and poverty level among seniors over the age of 75 in the United States with a correlation coefficient (R) of -0.449 and weighted average of 16.1%, a difference of 39.2%.
Seniors Poverty Over the Age of 75 Correlation Summary
| Measurement | Immigrants from Japan | Immigrants from Ecuador |
| Minimum | 4.0% | 1.9% |
| Maximum | 100.0% | 24.9% |
| Range | 96.0% | 23.0% |
| Mean | 22.7% | 14.7% |
| Median | 10.7% | 15.0% |
| Interquartile 25% (IQ1) | 9.4% | 12.0% |
| Interquartile 75% (IQ3) | 13.1% | 17.3% |
| Interquartile Range (IQR) | 3.7% | 5.4% |
| Standard Deviation (Sample) | 29.9% | 5.0% |
| Standard Deviation (Population) | 29.5% | 5.0% |
Similar Demographics by Seniors Poverty Over the Age of 75
Demographics Similar to Immigrants from Japan by Seniors Poverty Over the Age of 75
In terms of seniors poverty over the age of 75, the demographic groups most similar to Immigrants from Japan are Immigrants from Ethiopia (11.6%, a difference of 0.070%), Romanian (11.6%, a difference of 0.11%), Immigrants from Bosnia and Herzegovina (11.6%, a difference of 0.20%), Immigrants from Sweden (11.6%, a difference of 0.20%), and Syrian (11.6%, a difference of 0.23%).
| Demographics | Rating | Rank | Seniors Poverty Over the Age of 75 |
| Immigrants | Germany | 94.1 /100 | #91 | Exceptional 11.5% |
| Kenyans | 93.9 /100 | #92 | Exceptional 11.5% |
| Immigrants | Poland | 92.9 /100 | #93 | Exceptional 11.6% |
| Creek | 92.7 /100 | #94 | Exceptional 11.6% |
| Immigrants | Bosnia and Herzegovina | 92.6 /100 | #95 | Exceptional 11.6% |
| Immigrants | Sweden | 92.6 /100 | #96 | Exceptional 11.6% |
| Romanians | 92.3 /100 | #97 | Exceptional 11.6% |
| Immigrants | Japan | 91.9 /100 | #98 | Exceptional 11.6% |
| Immigrants | Ethiopia | 91.7 /100 | #99 | Exceptional 11.6% |
| Syrians | 91.1 /100 | #100 | Exceptional 11.6% |
| Jordanians | 90.8 /100 | #101 | Exceptional 11.6% |
| Guamanians/Chamorros | 90.6 /100 | #102 | Exceptional 11.6% |
| Immigrants | Kuwait | 90.5 /100 | #103 | Exceptional 11.6% |
| Immigrants | Singapore | 90.3 /100 | #104 | Exceptional 11.6% |
| Chickasaw | 90.2 /100 | #105 | Exceptional 11.6% |
Demographics Similar to Immigrants from Ecuador by Seniors Poverty Over the Age of 75
In terms of seniors poverty over the age of 75, the demographic groups most similar to Immigrants from Ecuador are Guyanese (16.1%, a difference of 0.010%), Tsimshian (16.1%, a difference of 0.31%), Immigrants from Guyana (16.2%, a difference of 0.61%), Barbadian (16.0%, a difference of 0.66%), and Houma (16.2%, a difference of 0.74%).
| Demographics | Rating | Rank | Seniors Poverty Over the Age of 75 |
| Yup'ik | 0.0 /100 | #309 | Tragic 15.8% |
| Vietnamese | 0.0 /100 | #310 | Tragic 15.9% |
| Trinidadians and Tobagonians | 0.0 /100 | #311 | Tragic 15.9% |
| Crow | 0.0 /100 | #312 | Tragic 15.9% |
| Barbadians | 0.0 /100 | #313 | Tragic 16.0% |
| Tsimshian | 0.0 /100 | #314 | Tragic 16.1% |
| Guyanese | 0.0 /100 | #315 | Tragic 16.1% |
| Immigrants | Ecuador | 0.0 /100 | #316 | Tragic 16.1% |
| Immigrants | Guyana | 0.0 /100 | #317 | Tragic 16.2% |
| Houma | 0.0 /100 | #318 | Tragic 16.2% |
| Haitians | 0.0 /100 | #319 | Tragic 16.2% |
| Immigrants | Yemen | 0.0 /100 | #320 | Tragic 16.5% |
| Immigrants | Haiti | 0.0 /100 | #321 | Tragic 16.5% |
| Immigrants | Barbados | 0.0 /100 | #322 | Tragic 16.5% |
| Central American Indians | 0.0 /100 | #323 | Tragic 16.5% |