Immigrants from Italy vs Arapaho Female Poverty
COMPARE
Immigrants from Italy
Arapaho
Female Poverty
Female Poverty Comparison
Immigrants from Italy
Arapaho
12.2%
FEMALE POVERTY
98.0/ 100
METRIC RATING
62nd/ 347
METRIC RANK
17.5%
FEMALE POVERTY
0.0/ 100
METRIC RATING
321st/ 347
METRIC RANK
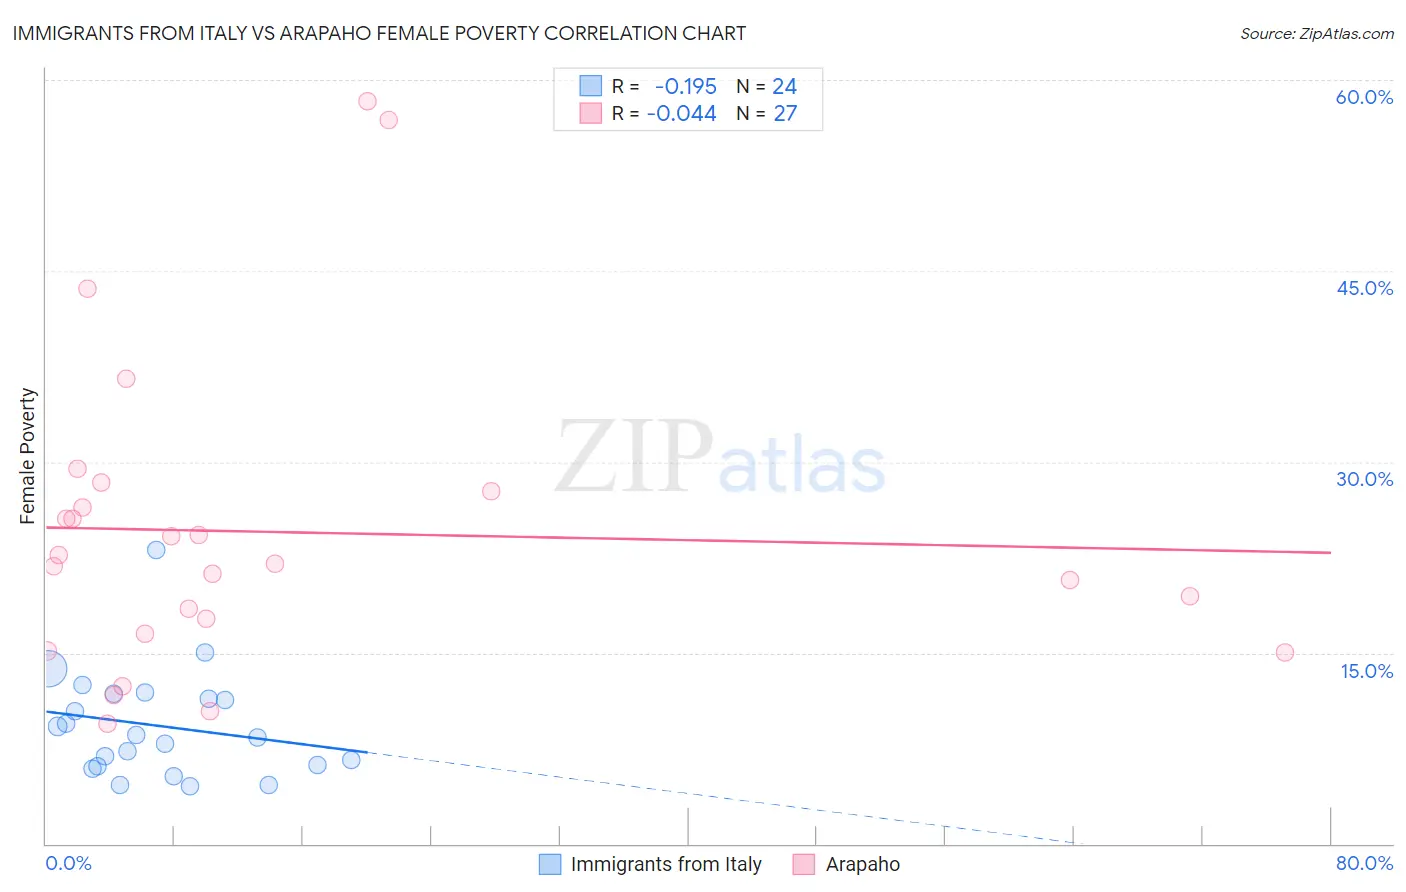
Immigrants from Italy vs Arapaho Female Poverty Correlation Chart
The statistical analysis conducted on geographies consisting of 324,078,093 people shows a poor negative correlation between the proportion of Immigrants from Italy and poverty level among females in the United States with a correlation coefficient (R) of -0.195 and weighted average of 12.2%. Similarly, the statistical analysis conducted on geographies consisting of 29,777,916 people shows no correlation between the proportion of Arapaho and poverty level among females in the United States with a correlation coefficient (R) of -0.044 and weighted average of 17.5%, a difference of 43.6%.
Female Poverty Correlation Summary
| Measurement | Immigrants from Italy | Arapaho |
| Minimum | 4.5% | 9.4% |
| Maximum | 23.1% | 58.3% |
| Range | 18.5% | 48.9% |
| Mean | 9.3% | 24.5% |
| Median | 8.4% | 22.0% |
| Interquartile 25% (IQ1) | 6.1% | 16.5% |
| Interquartile 75% (IQ3) | 11.6% | 27.7% |
| Interquartile Range (IQR) | 5.5% | 11.2% |
| Standard Deviation (Sample) | 4.2% | 12.2% |
| Standard Deviation (Population) | 4.1% | 12.0% |
Similar Demographics by Female Poverty
Demographics Similar to Immigrants from Italy by Female Poverty
In terms of female poverty, the demographic groups most similar to Immigrants from Italy are Immigrants from Asia (12.2%, a difference of 0.020%), Immigrants from Australia (12.2%, a difference of 0.030%), Ukrainian (12.2%, a difference of 0.080%), German (12.2%, a difference of 0.11%), and Indian (Asian) (12.2%, a difference of 0.14%).
| Demographics | Rating | Rank | Female Poverty |
| Immigrants | Sri Lanka | 98.5 /100 | #55 | Exceptional 12.1% |
| Estonians | 98.3 /100 | #56 | Exceptional 12.1% |
| Immigrants | Serbia | 98.3 /100 | #57 | Exceptional 12.1% |
| Scandinavians | 98.2 /100 | #58 | Exceptional 12.1% |
| Immigrants | Europe | 98.2 /100 | #59 | Exceptional 12.1% |
| Immigrants | Australia | 98.1 /100 | #60 | Exceptional 12.2% |
| Immigrants | Asia | 98.1 /100 | #61 | Exceptional 12.2% |
| Immigrants | Italy | 98.0 /100 | #62 | Exceptional 12.2% |
| Ukrainians | 98.0 /100 | #63 | Exceptional 12.2% |
| Germans | 98.0 /100 | #64 | Exceptional 12.2% |
| Indians (Asian) | 97.9 /100 | #65 | Exceptional 12.2% |
| Austrians | 97.9 /100 | #66 | Exceptional 12.2% |
| Immigrants | Eastern Asia | 97.8 /100 | #67 | Exceptional 12.2% |
| Immigrants | Netherlands | 97.8 /100 | #68 | Exceptional 12.2% |
| Swiss | 97.7 /100 | #69 | Exceptional 12.2% |
Demographics Similar to Arapaho by Female Poverty
In terms of female poverty, the demographic groups most similar to Arapaho are Immigrants from Dominica (17.5%, a difference of 0.060%), Cajun (17.5%, a difference of 0.15%), Ute (17.5%, a difference of 0.16%), Immigrants from Congo (17.4%, a difference of 0.48%), and Menominee (17.6%, a difference of 0.65%).
| Demographics | Rating | Rank | Female Poverty |
| Dutch West Indians | 0.0 /100 | #314 | Tragic 17.1% |
| U.S. Virgin Islanders | 0.0 /100 | #315 | Tragic 17.3% |
| Hondurans | 0.0 /100 | #316 | Tragic 17.4% |
| Immigrants | Congo | 0.0 /100 | #317 | Tragic 17.4% |
| Ute | 0.0 /100 | #318 | Tragic 17.5% |
| Cajuns | 0.0 /100 | #319 | Tragic 17.5% |
| Immigrants | Dominica | 0.0 /100 | #320 | Tragic 17.5% |
| Arapaho | 0.0 /100 | #321 | Tragic 17.5% |
| Menominee | 0.0 /100 | #322 | Tragic 17.6% |
| Paiute | 0.0 /100 | #323 | Tragic 17.7% |
| Immigrants | Honduras | 0.0 /100 | #324 | Tragic 17.7% |
| Colville | 0.0 /100 | #325 | Tragic 17.8% |
| Central American Indians | 0.0 /100 | #326 | Tragic 18.0% |
| Yakama | 0.0 /100 | #327 | Tragic 18.0% |
| Blacks/African Americans | 0.0 /100 | #328 | Tragic 18.6% |